I’ve decided to create a post where I can regularly update some favorite data visualizations. Where I’ve previously discussed the data or shared code I will provide a link. Often I’ll update the charts and post them on Twitter soon after the data is released. I won’t be updating these that quickly, but I’ll do my best to keep up.
As I update some more charts I may add to the list. I might not update with every release, so I’ll indicate the last update for each chart.
Your favorite chart isn’t here? Let me know and maybe I can add it.
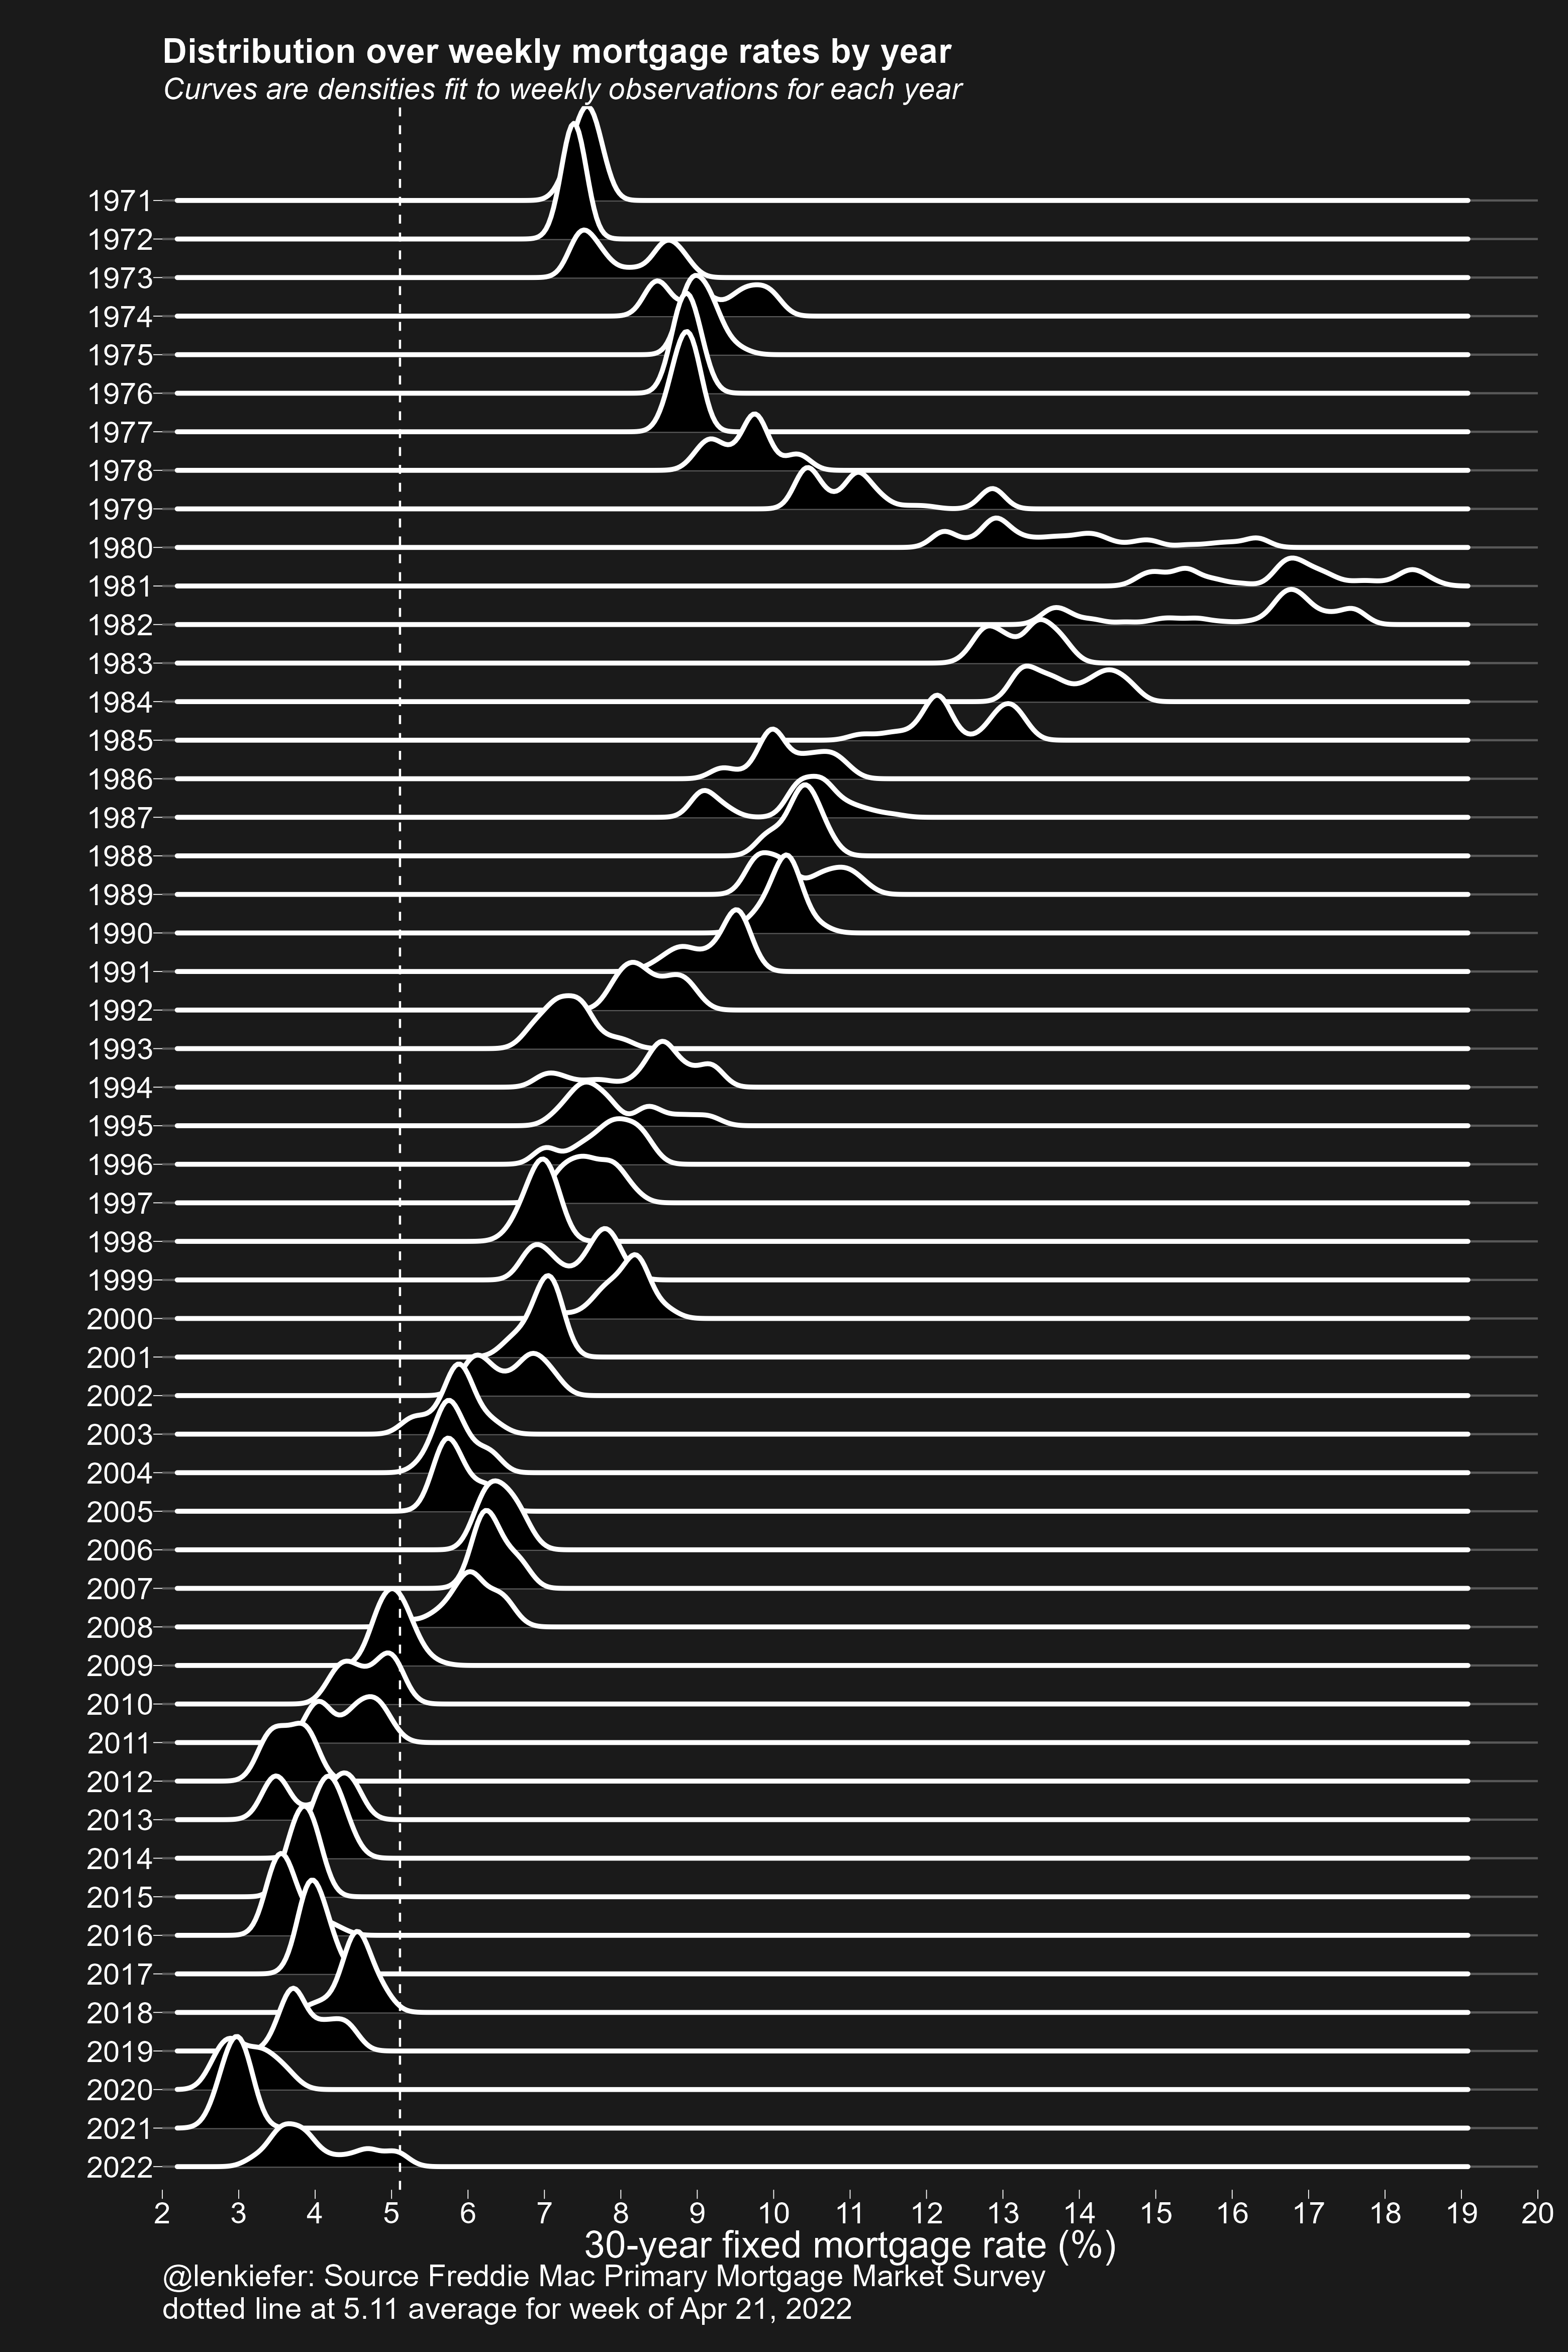
Mortgage Rates
Last updated 2020-12-10
Post Visualizing consumer price inflation and mortgage rates
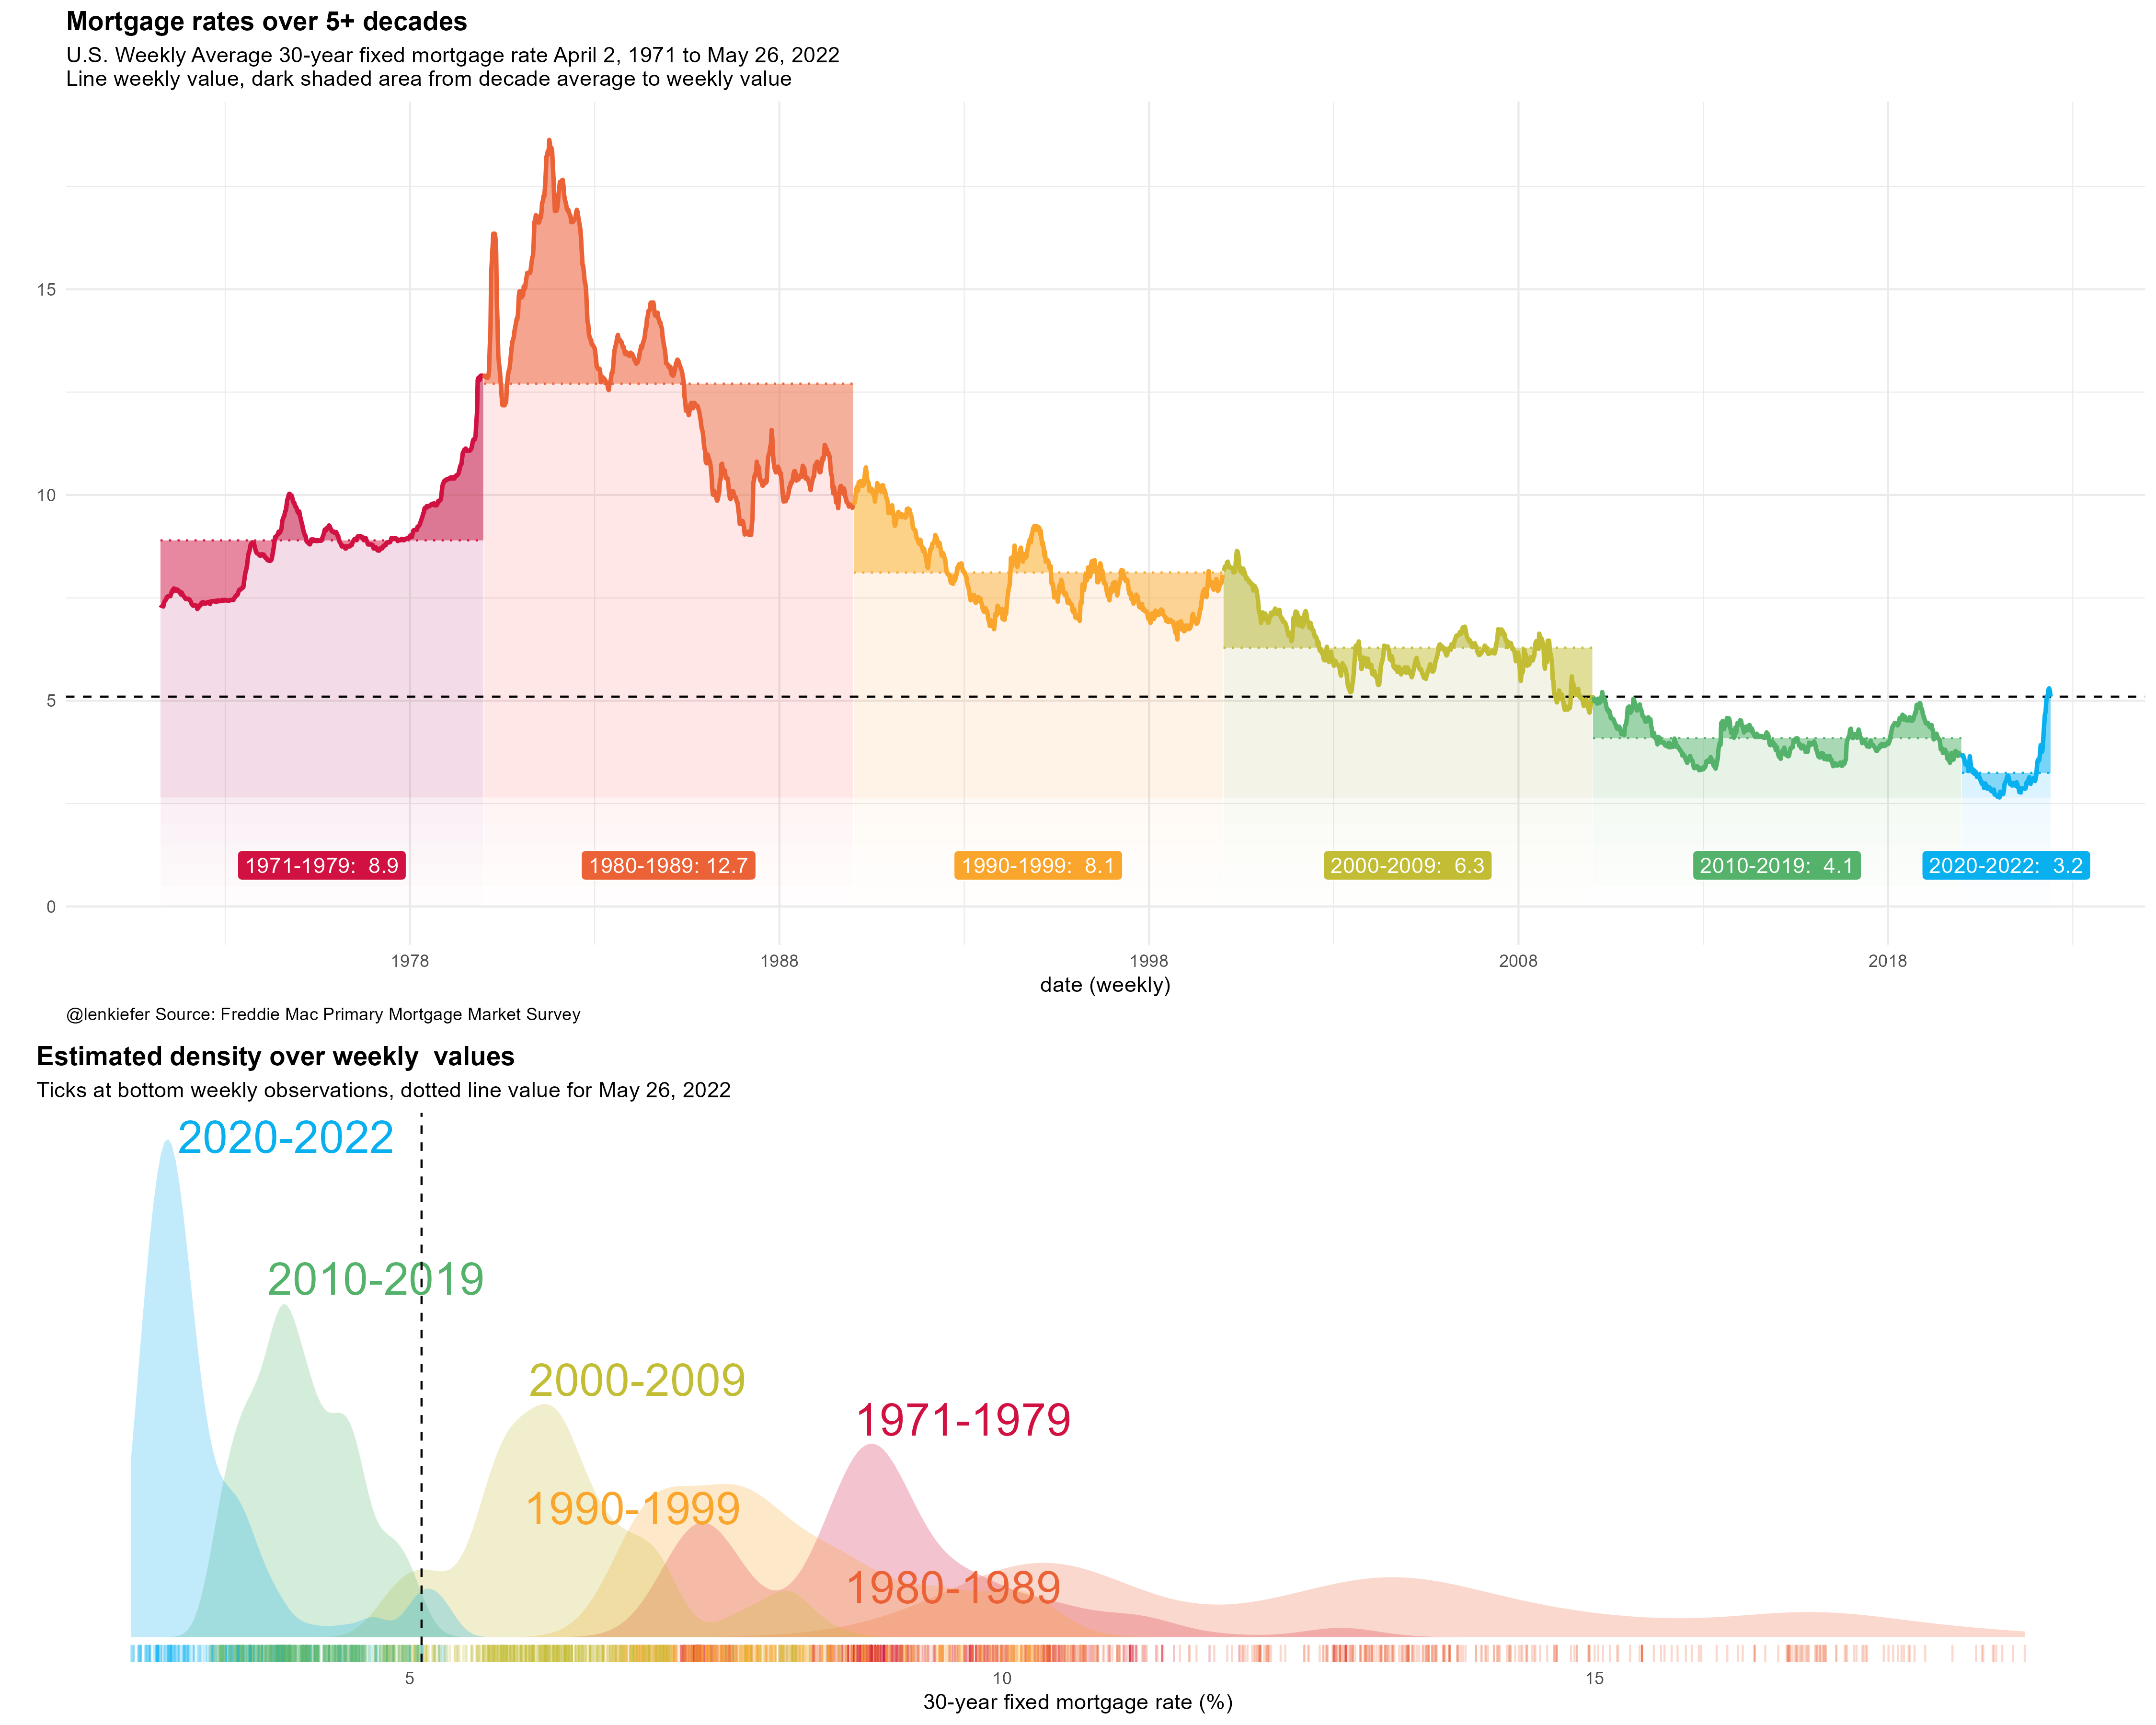
Last updated 2020-12-10
Post Mortgage rates hit a record low Another record low on 2020-11-25
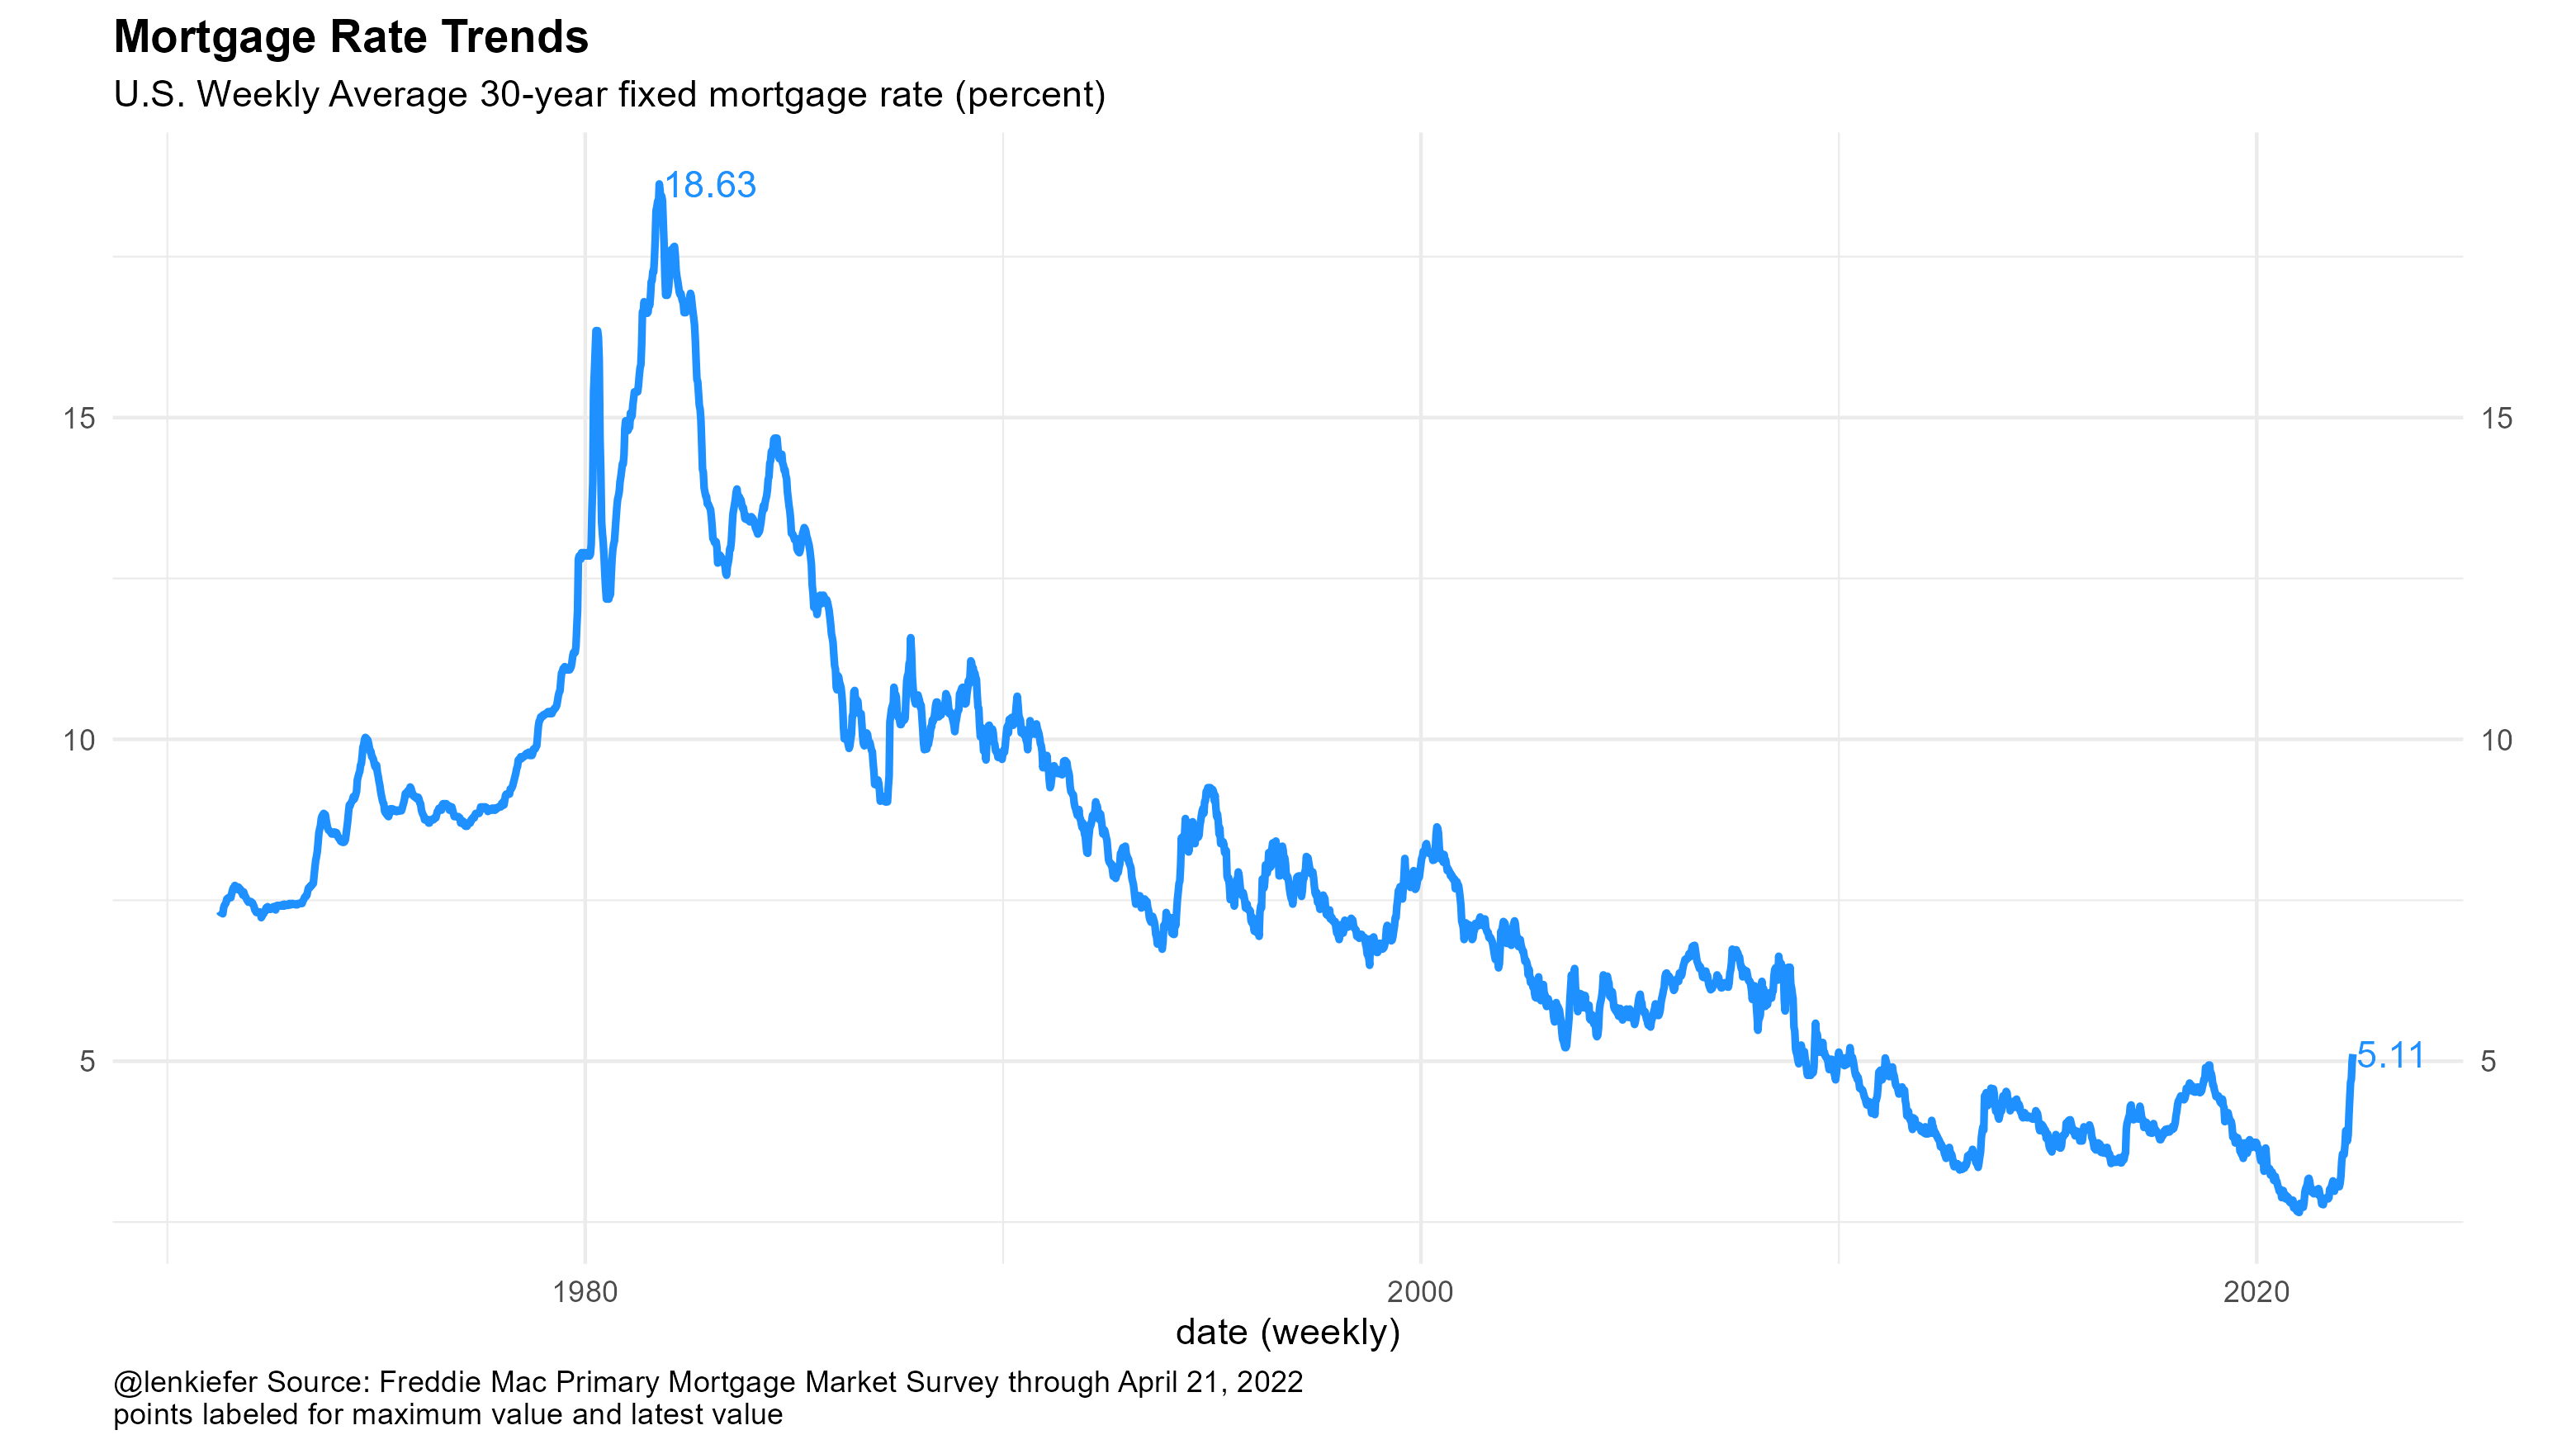
Last updated 2020-12-10
Post Chart Style 1979
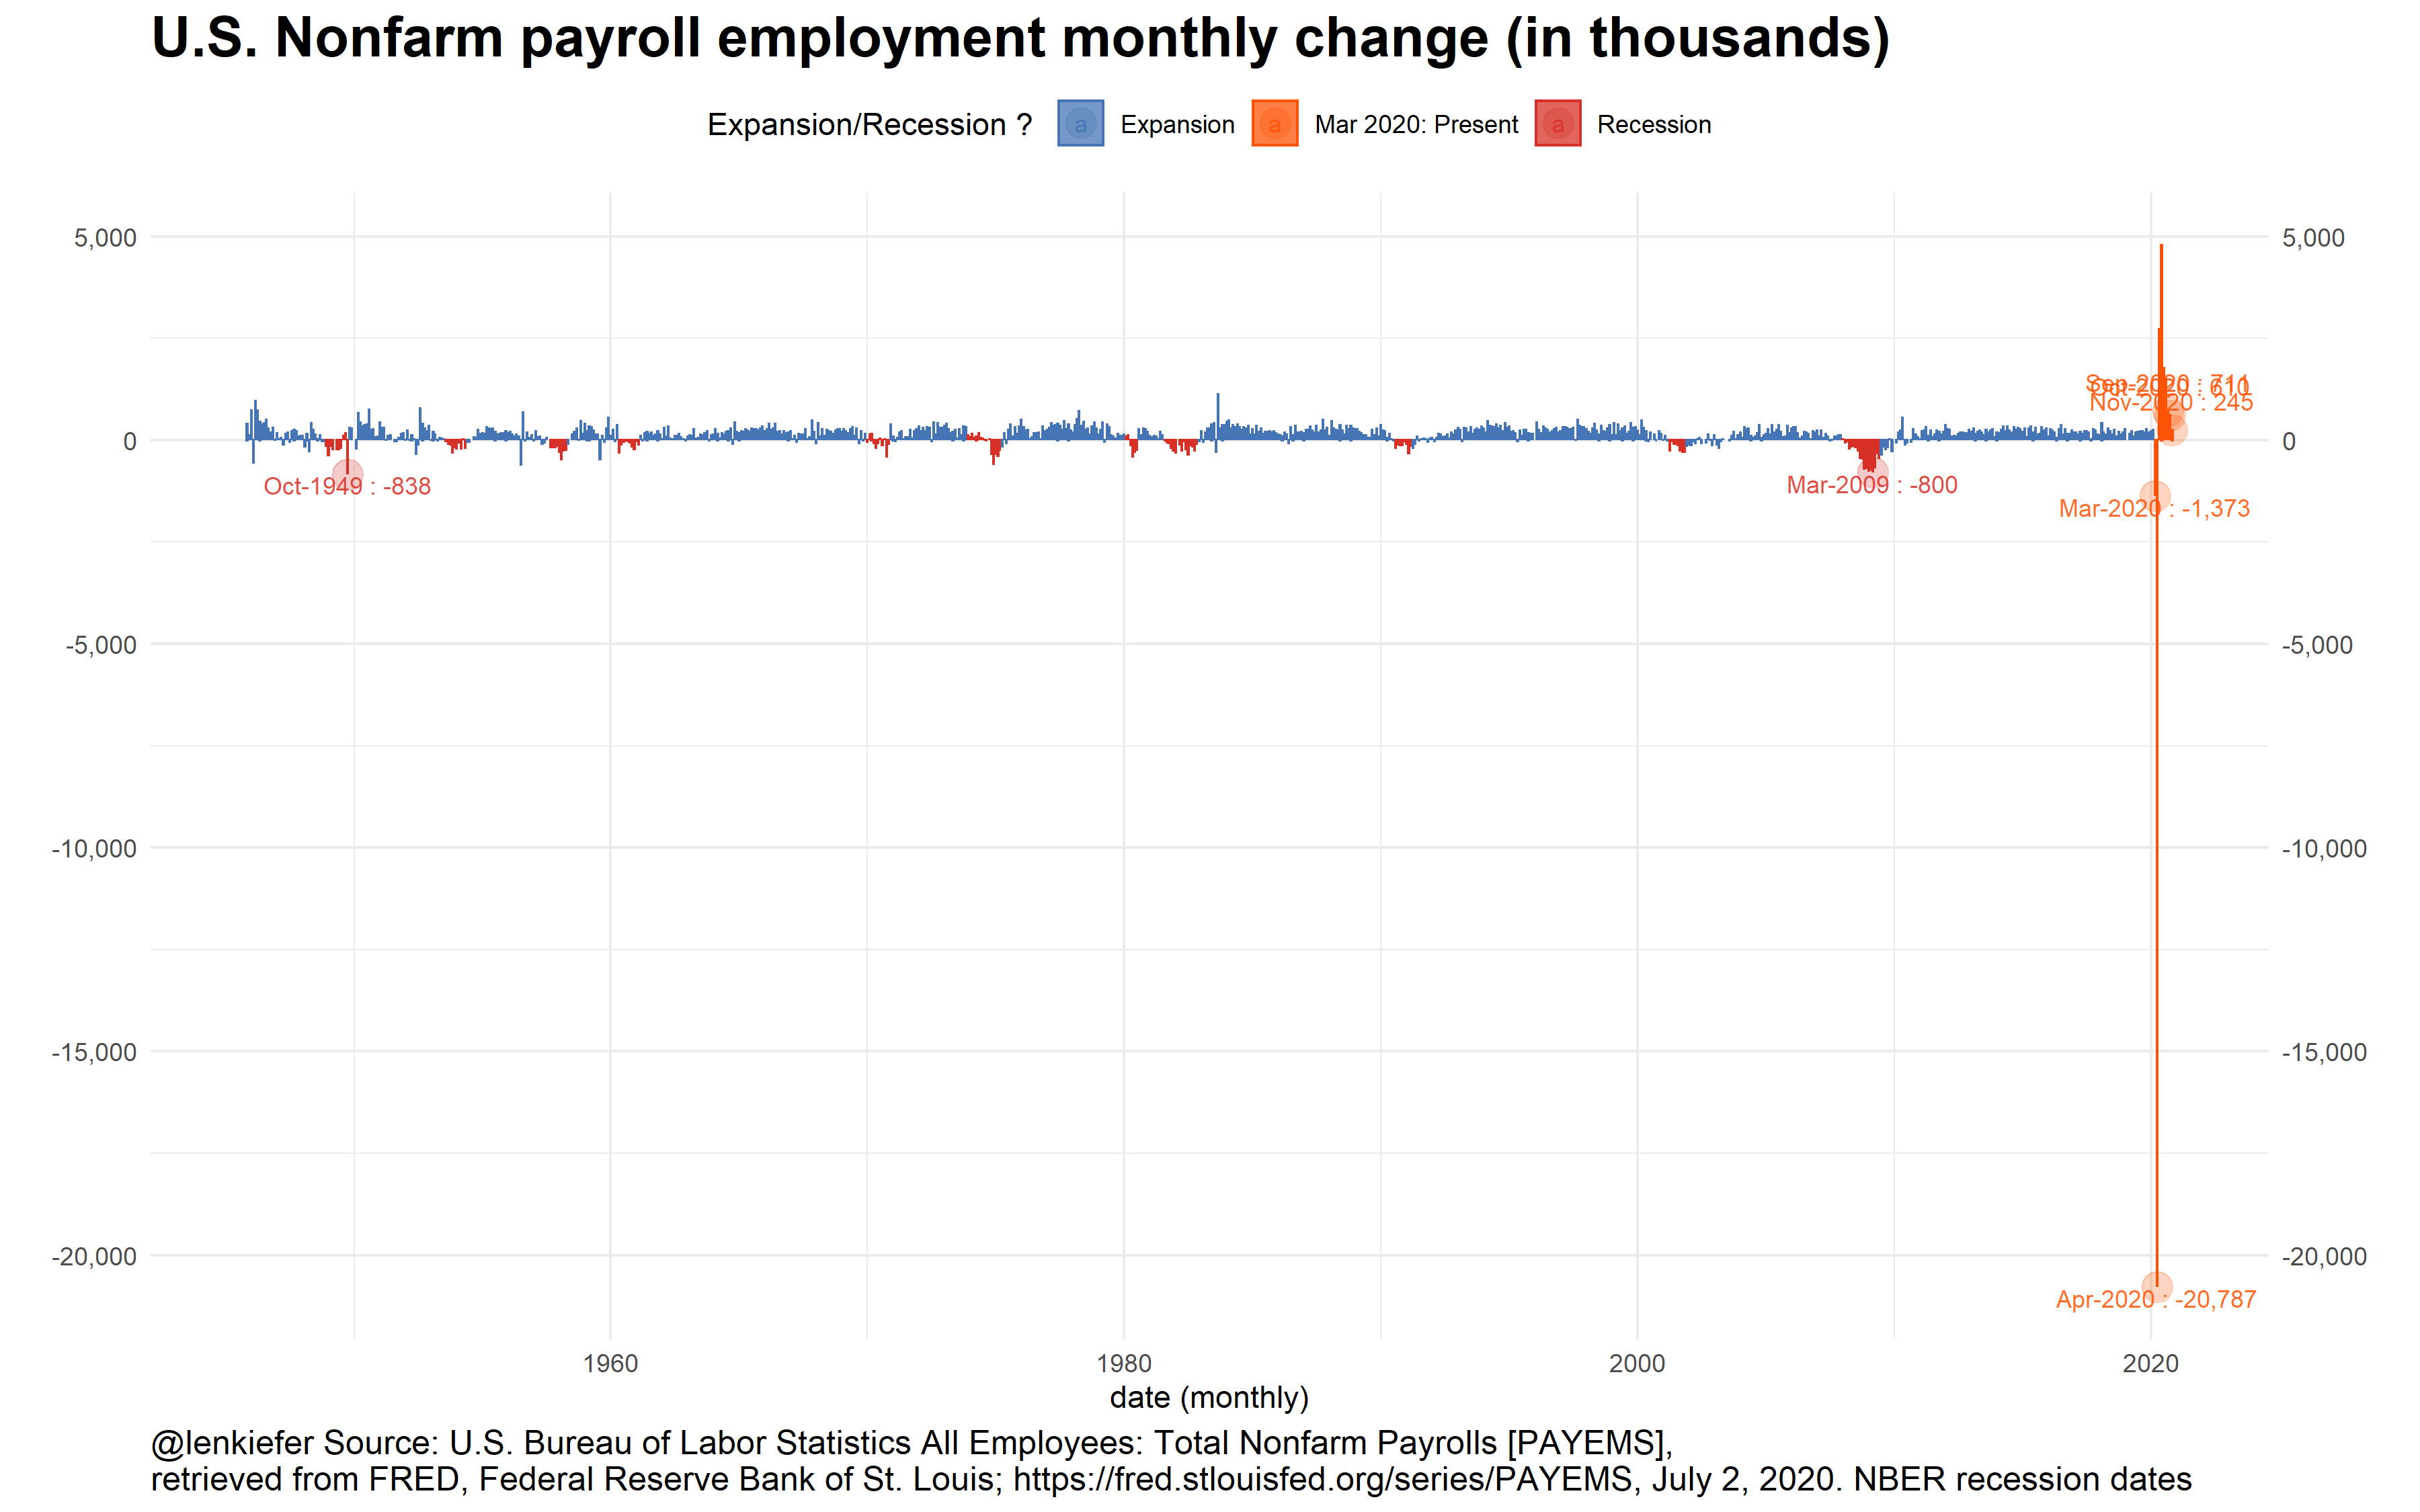
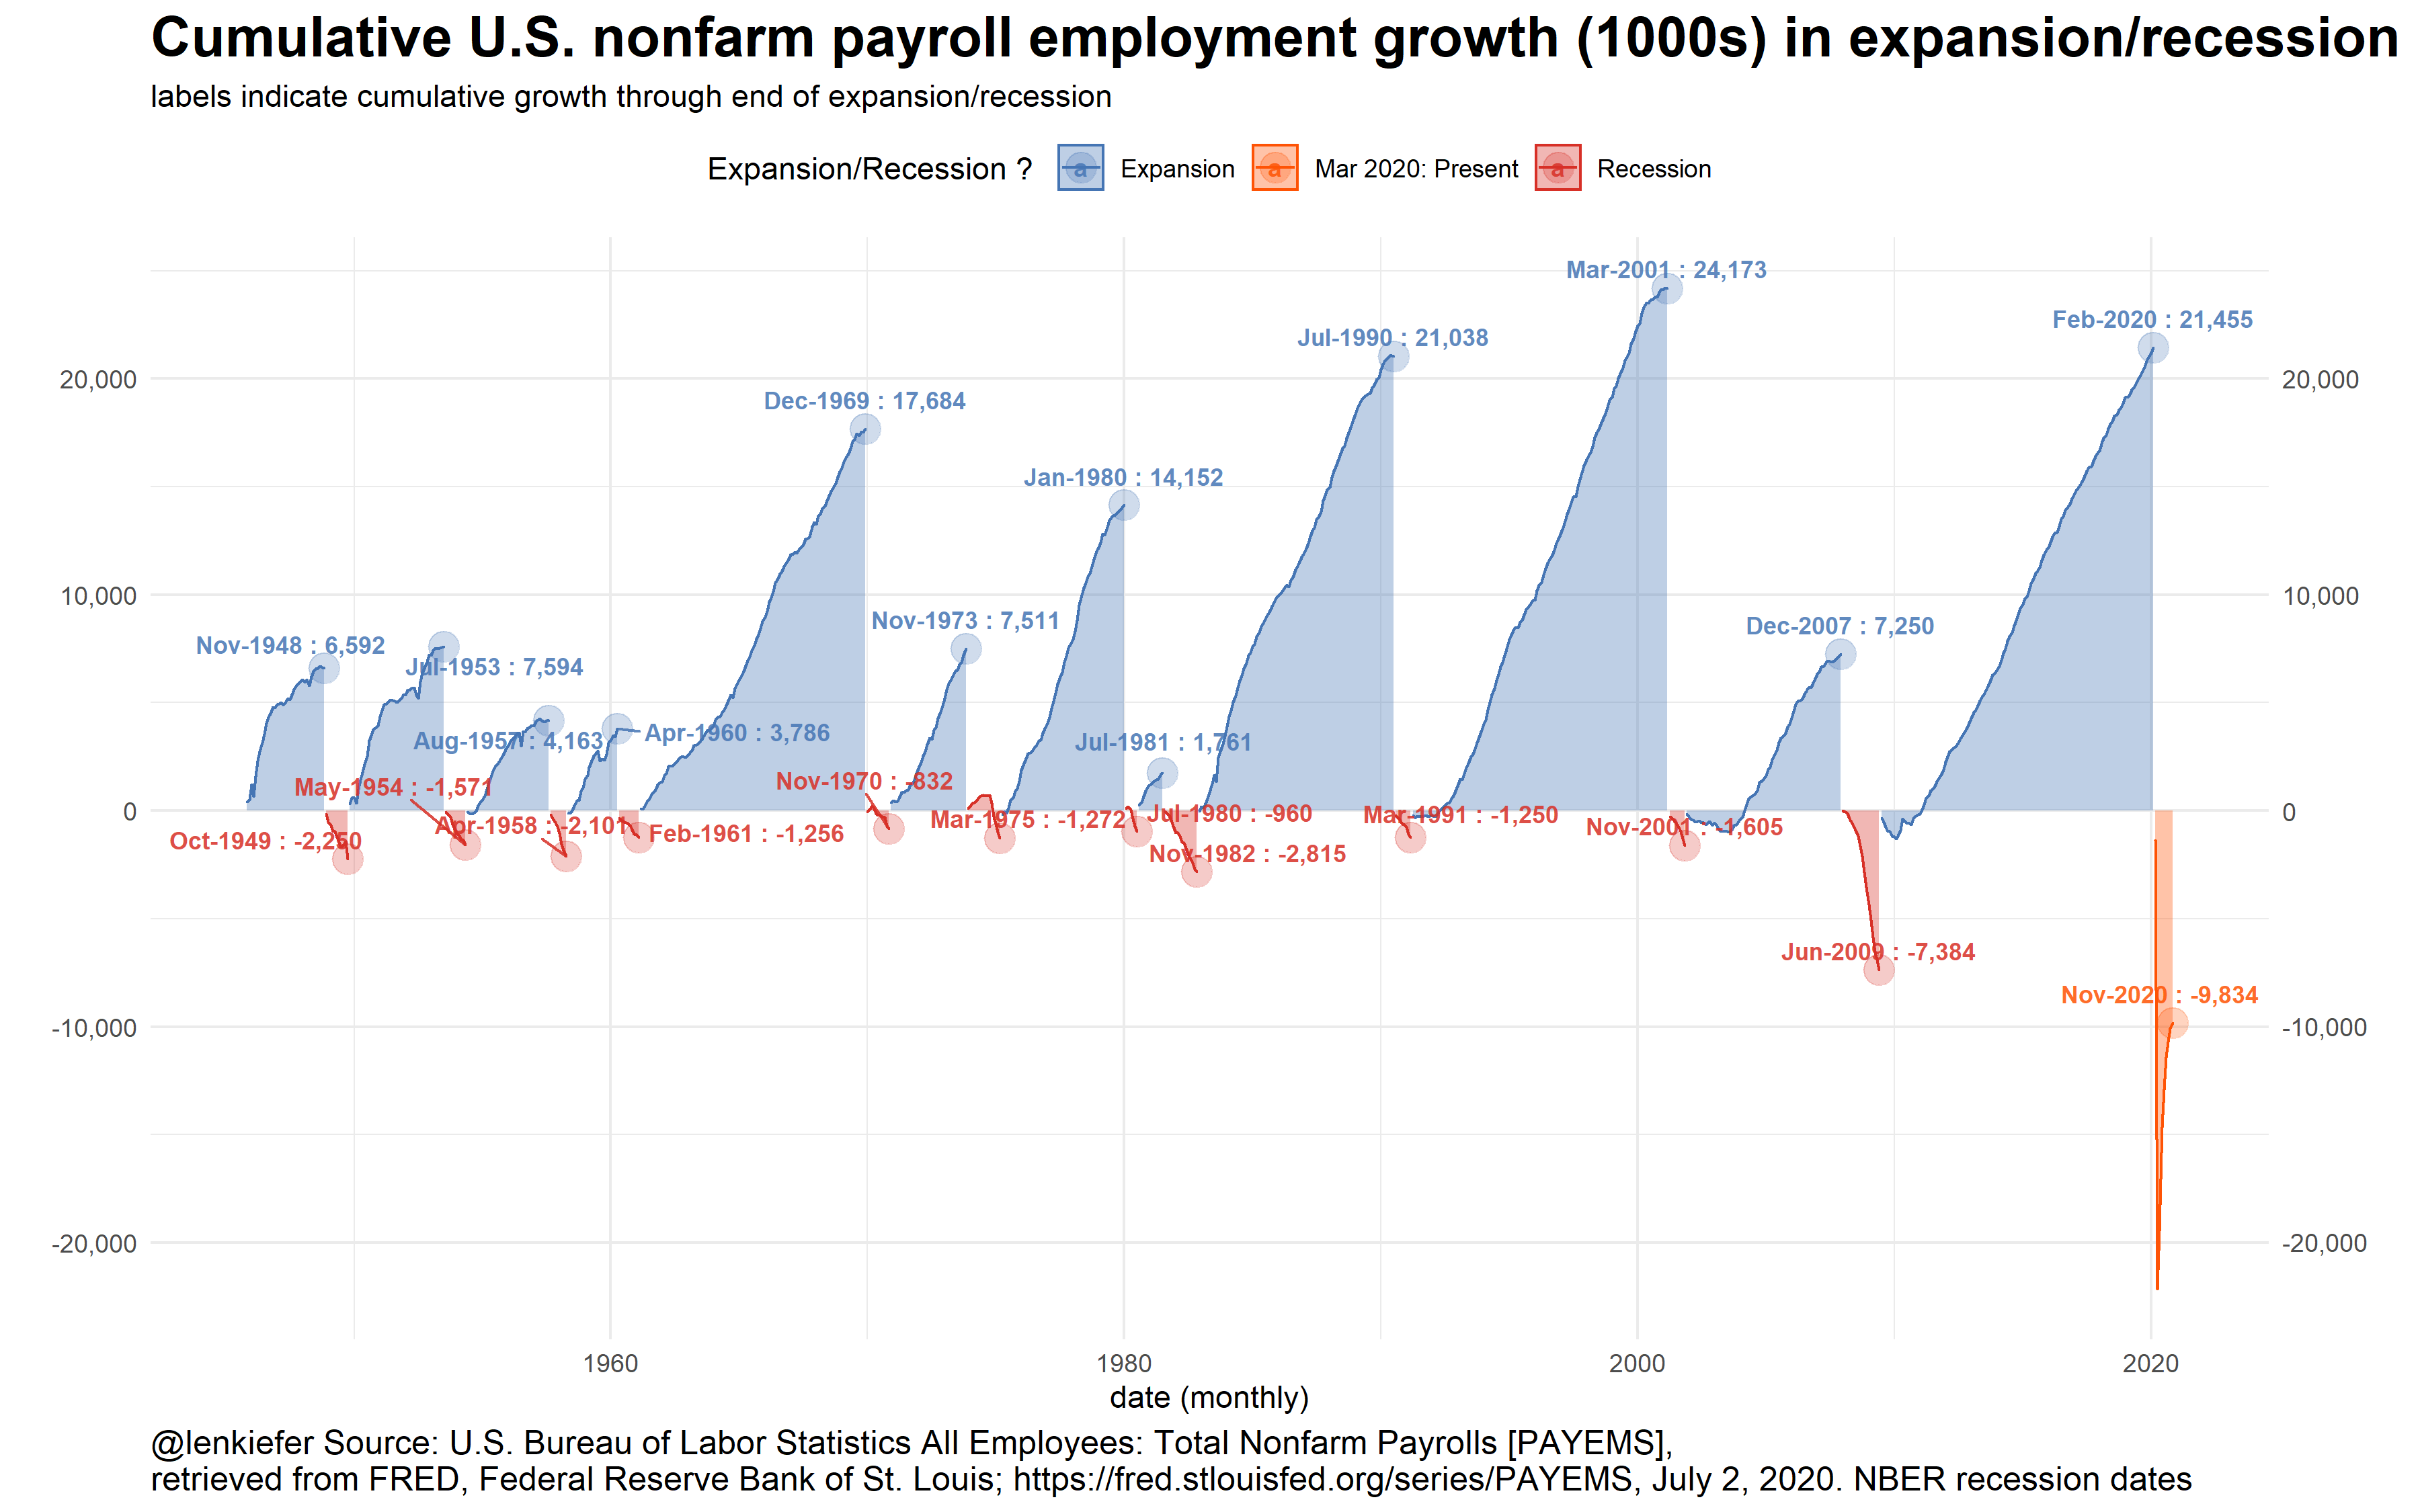
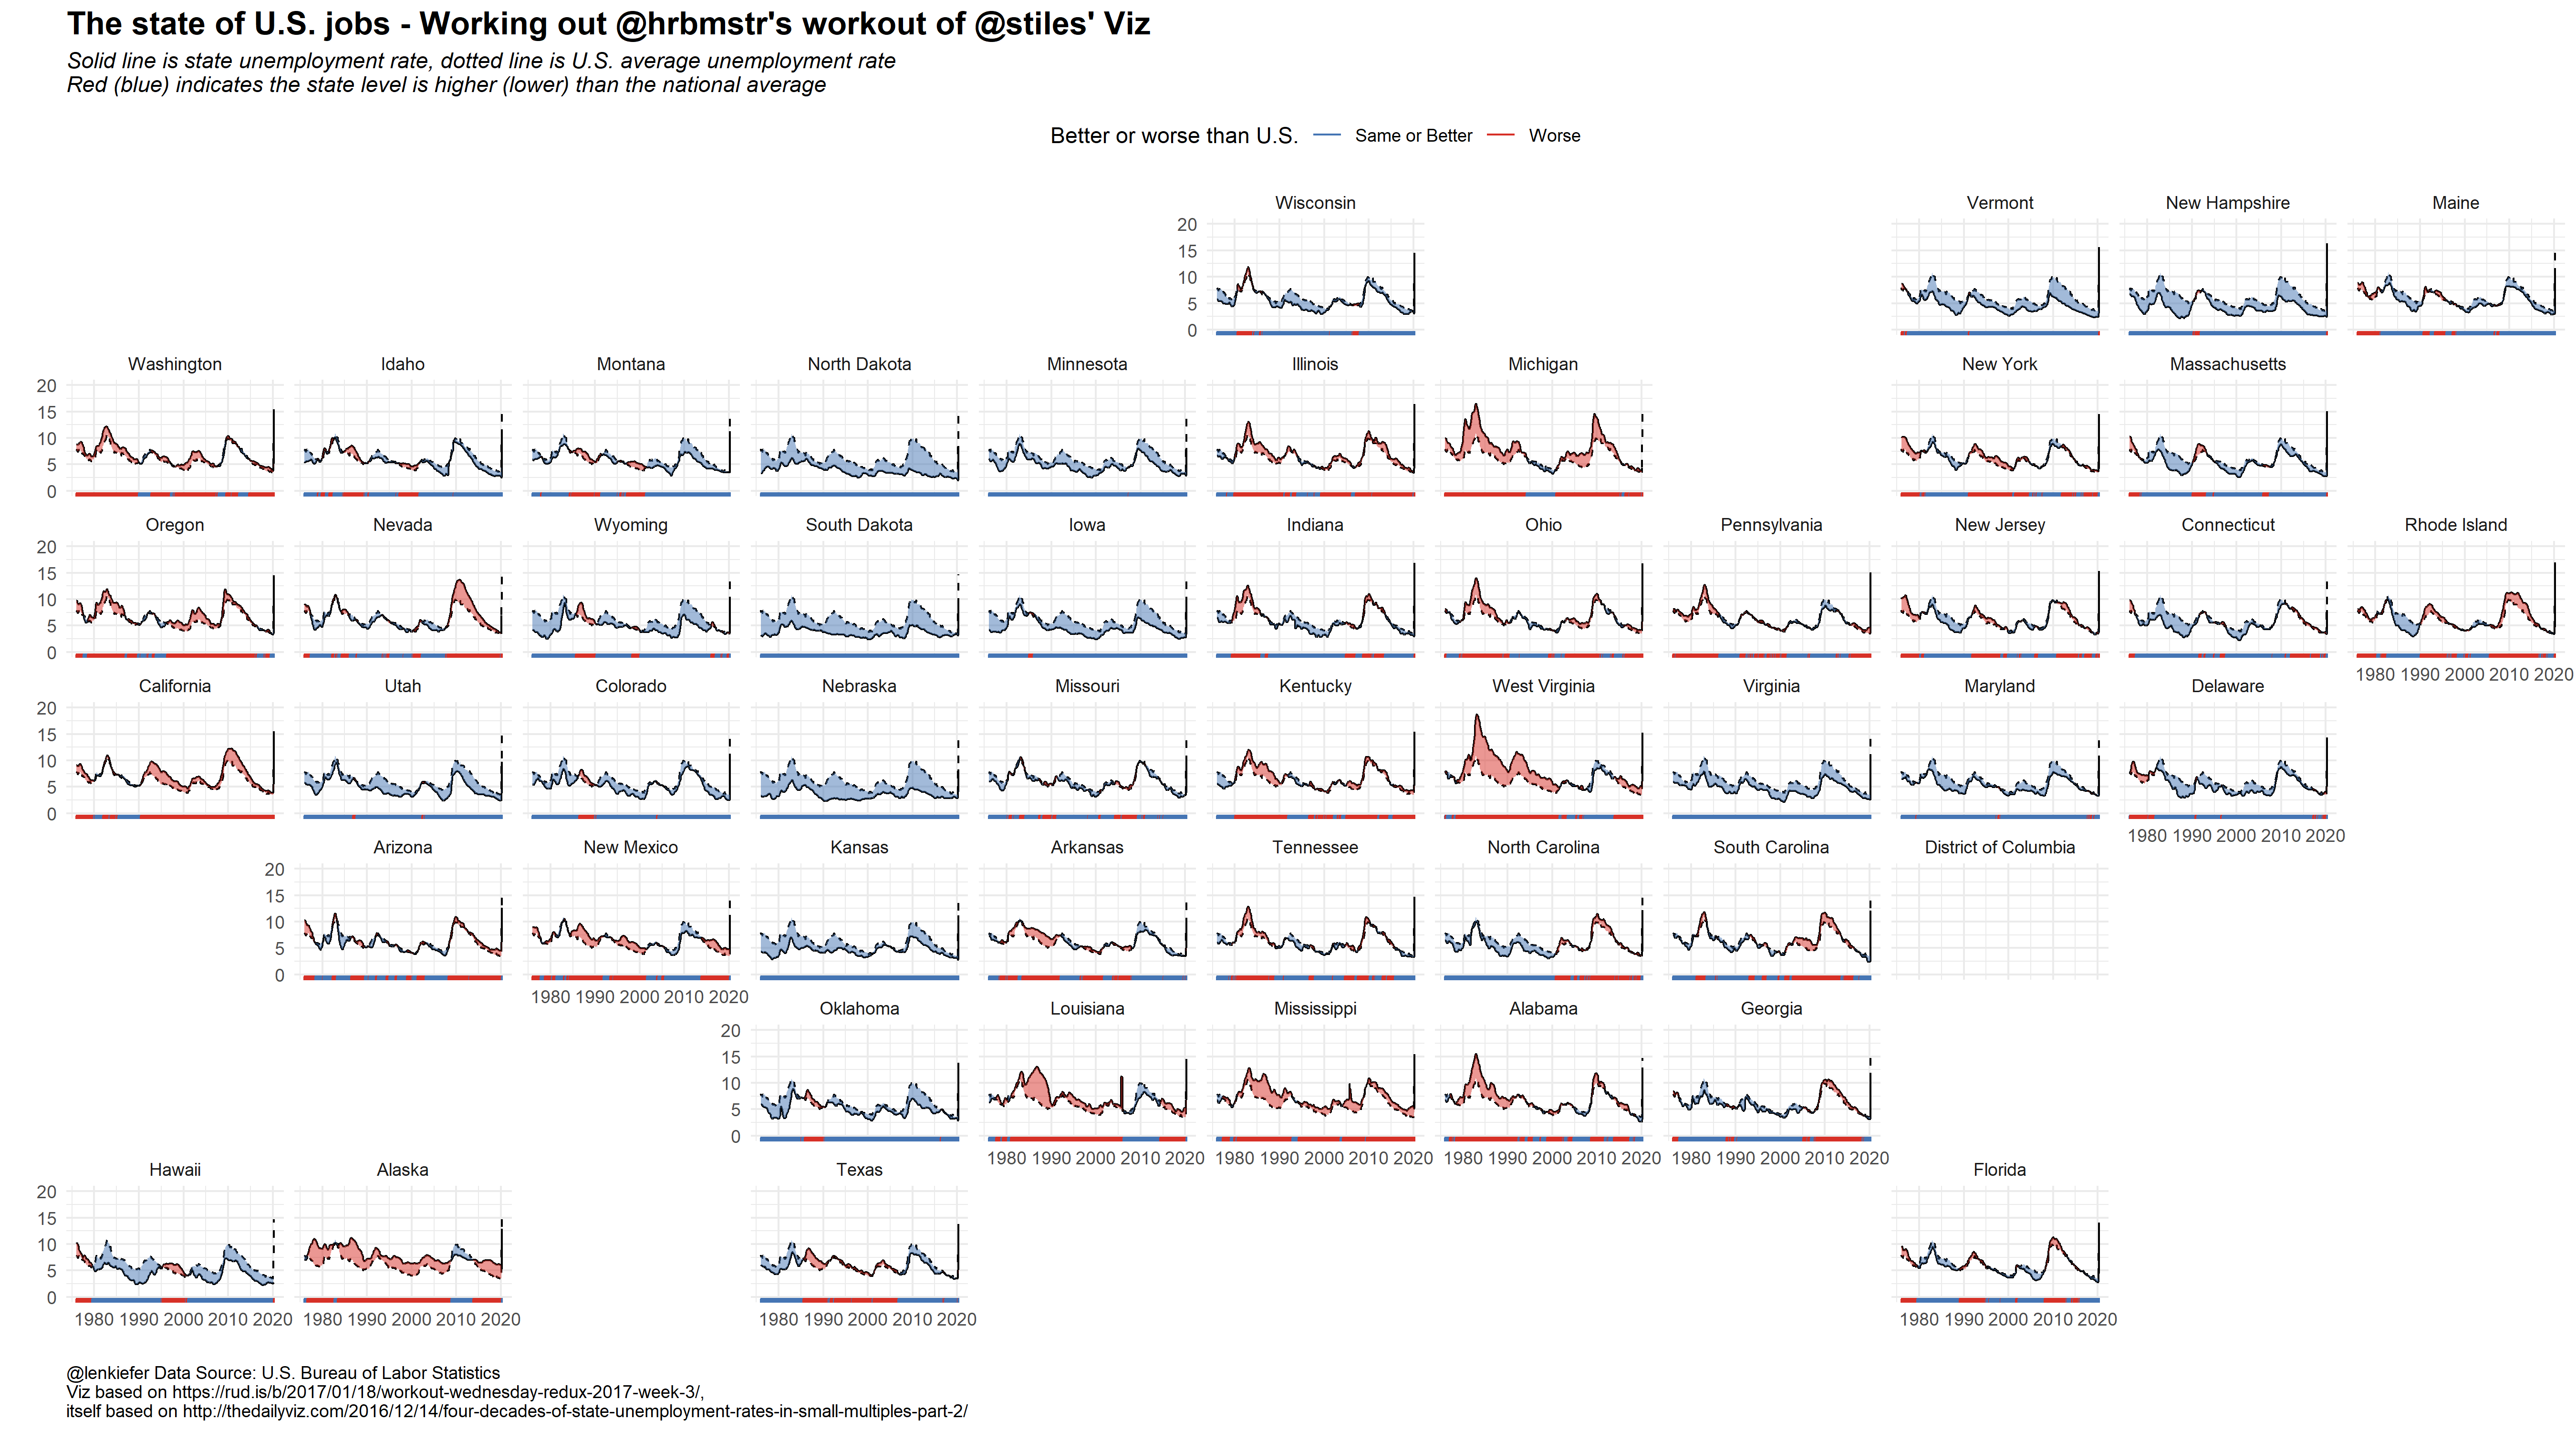
Jobless claims animations
Last updated 2020-12-10
Animated versions of my jobless claims charts.
Post: Labor Market Update

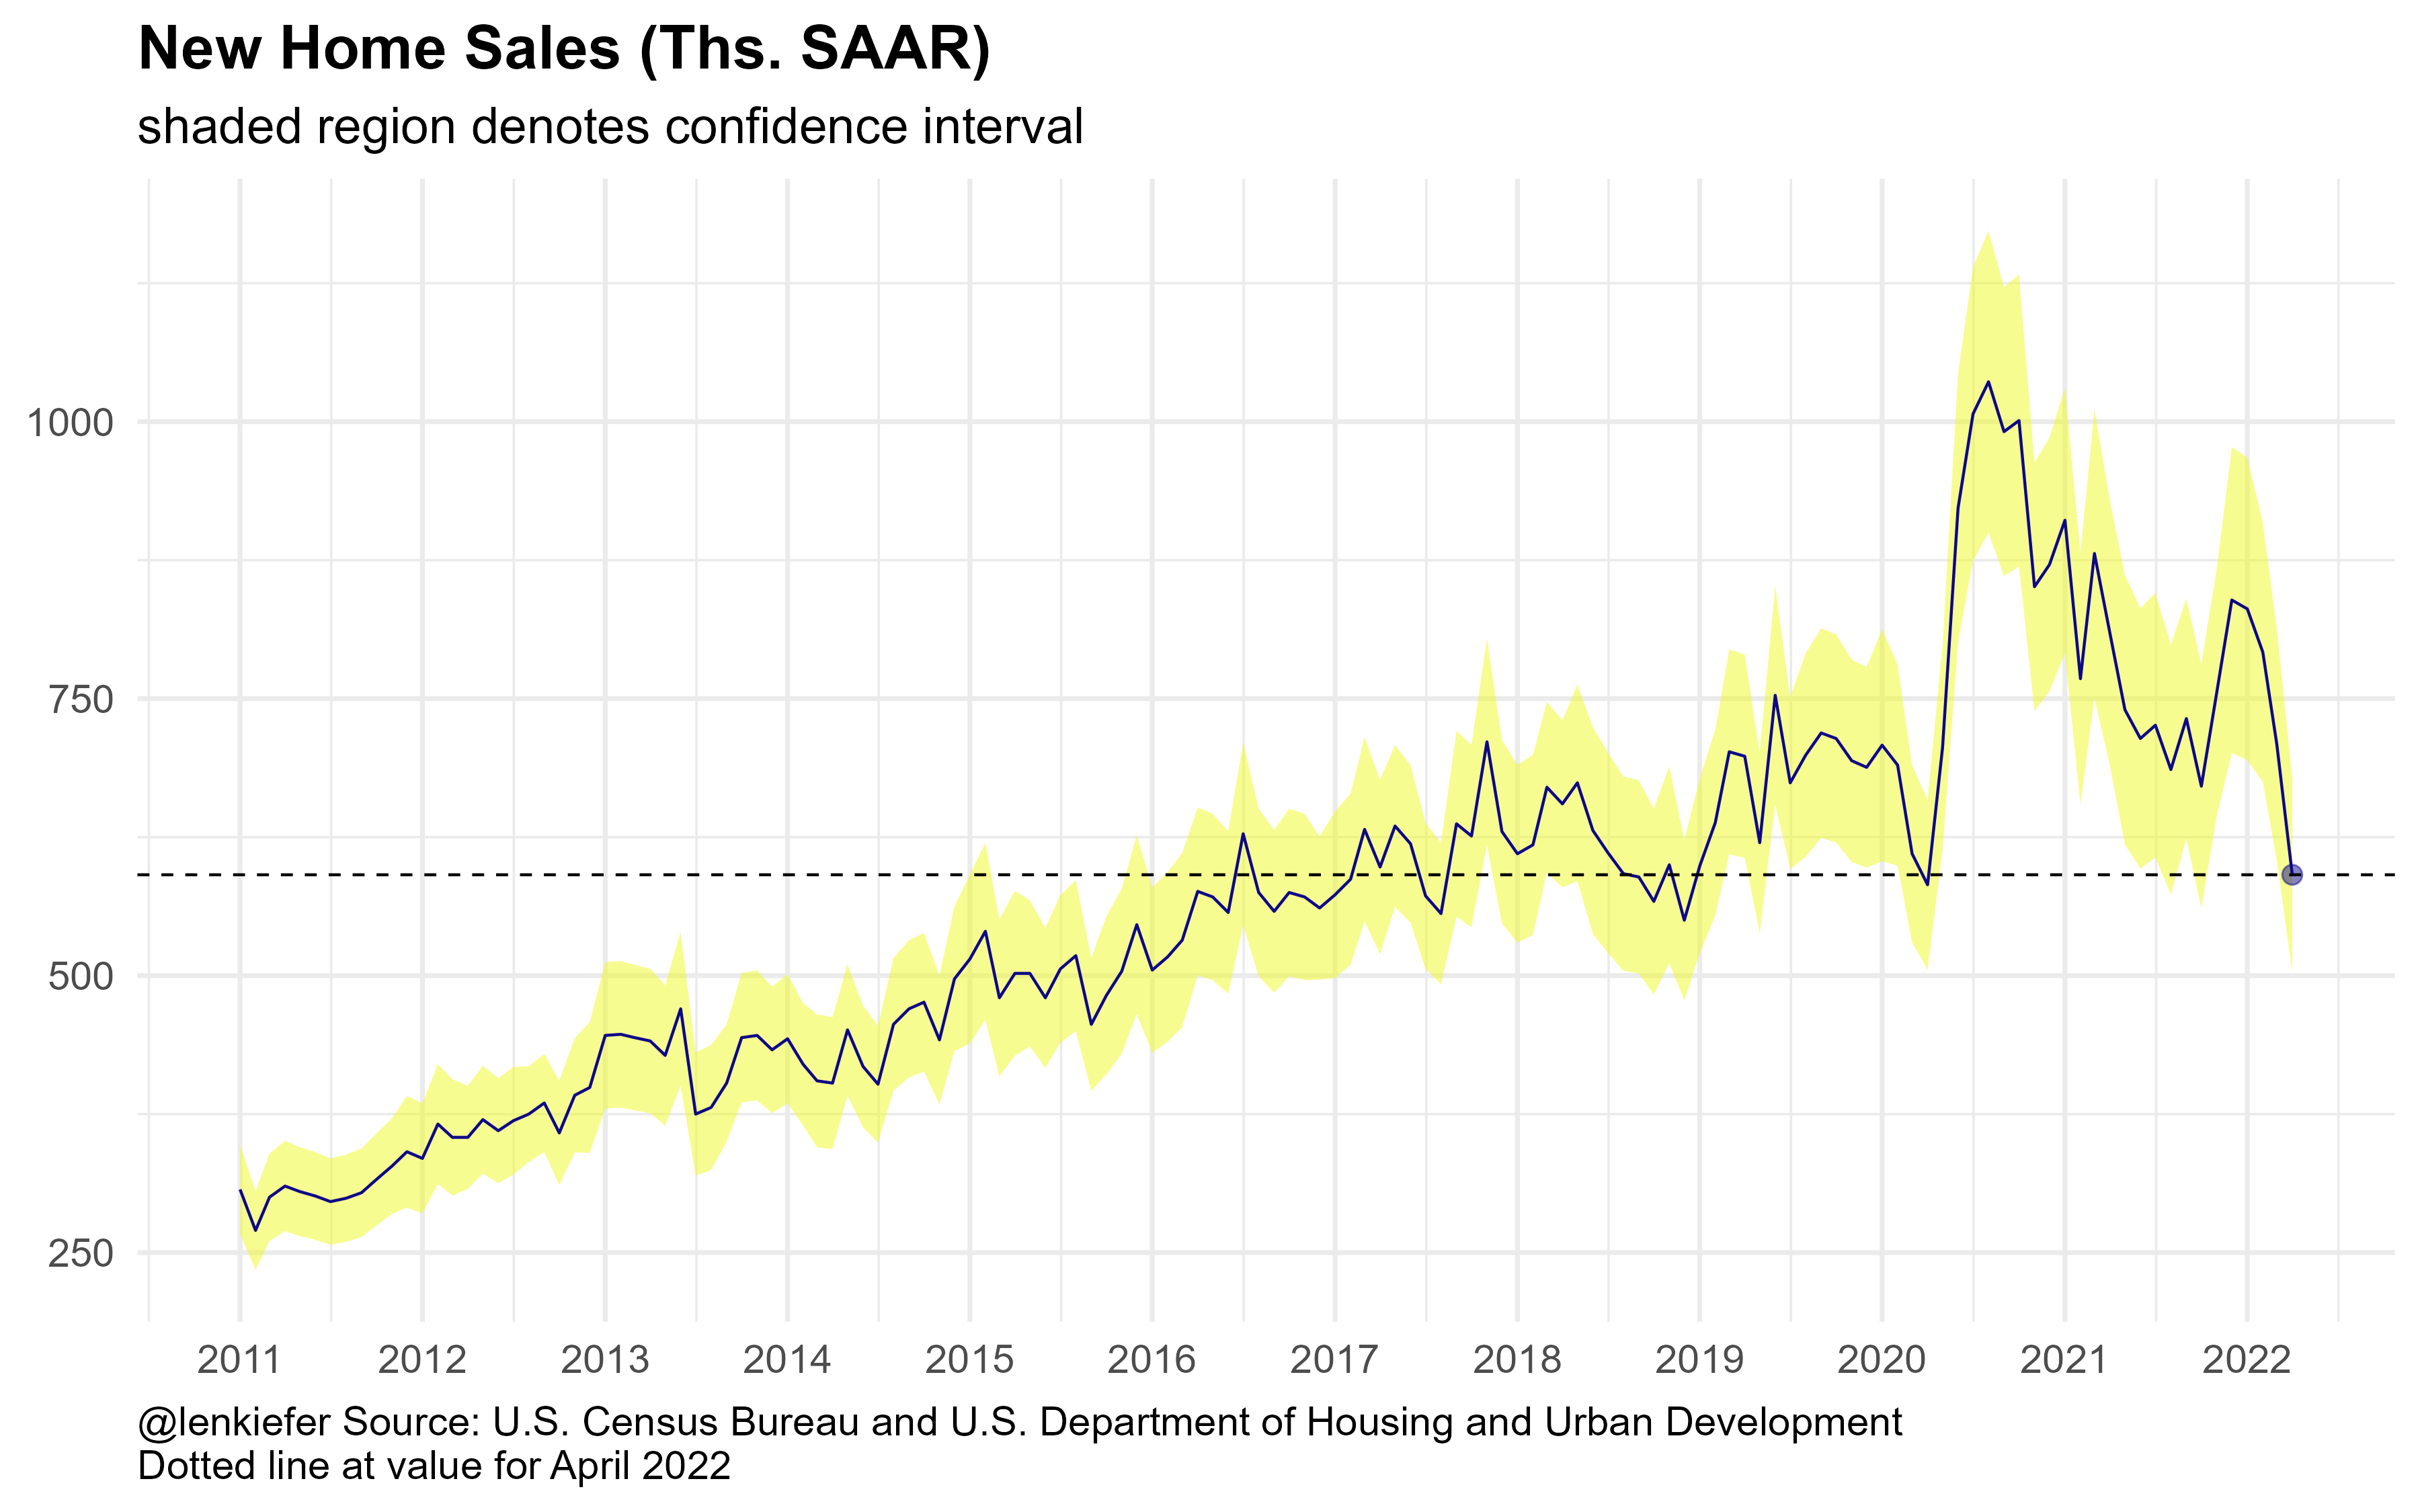
New Home Sales
Last updated 2020-11-25
Post: Housing usually heats up in summer
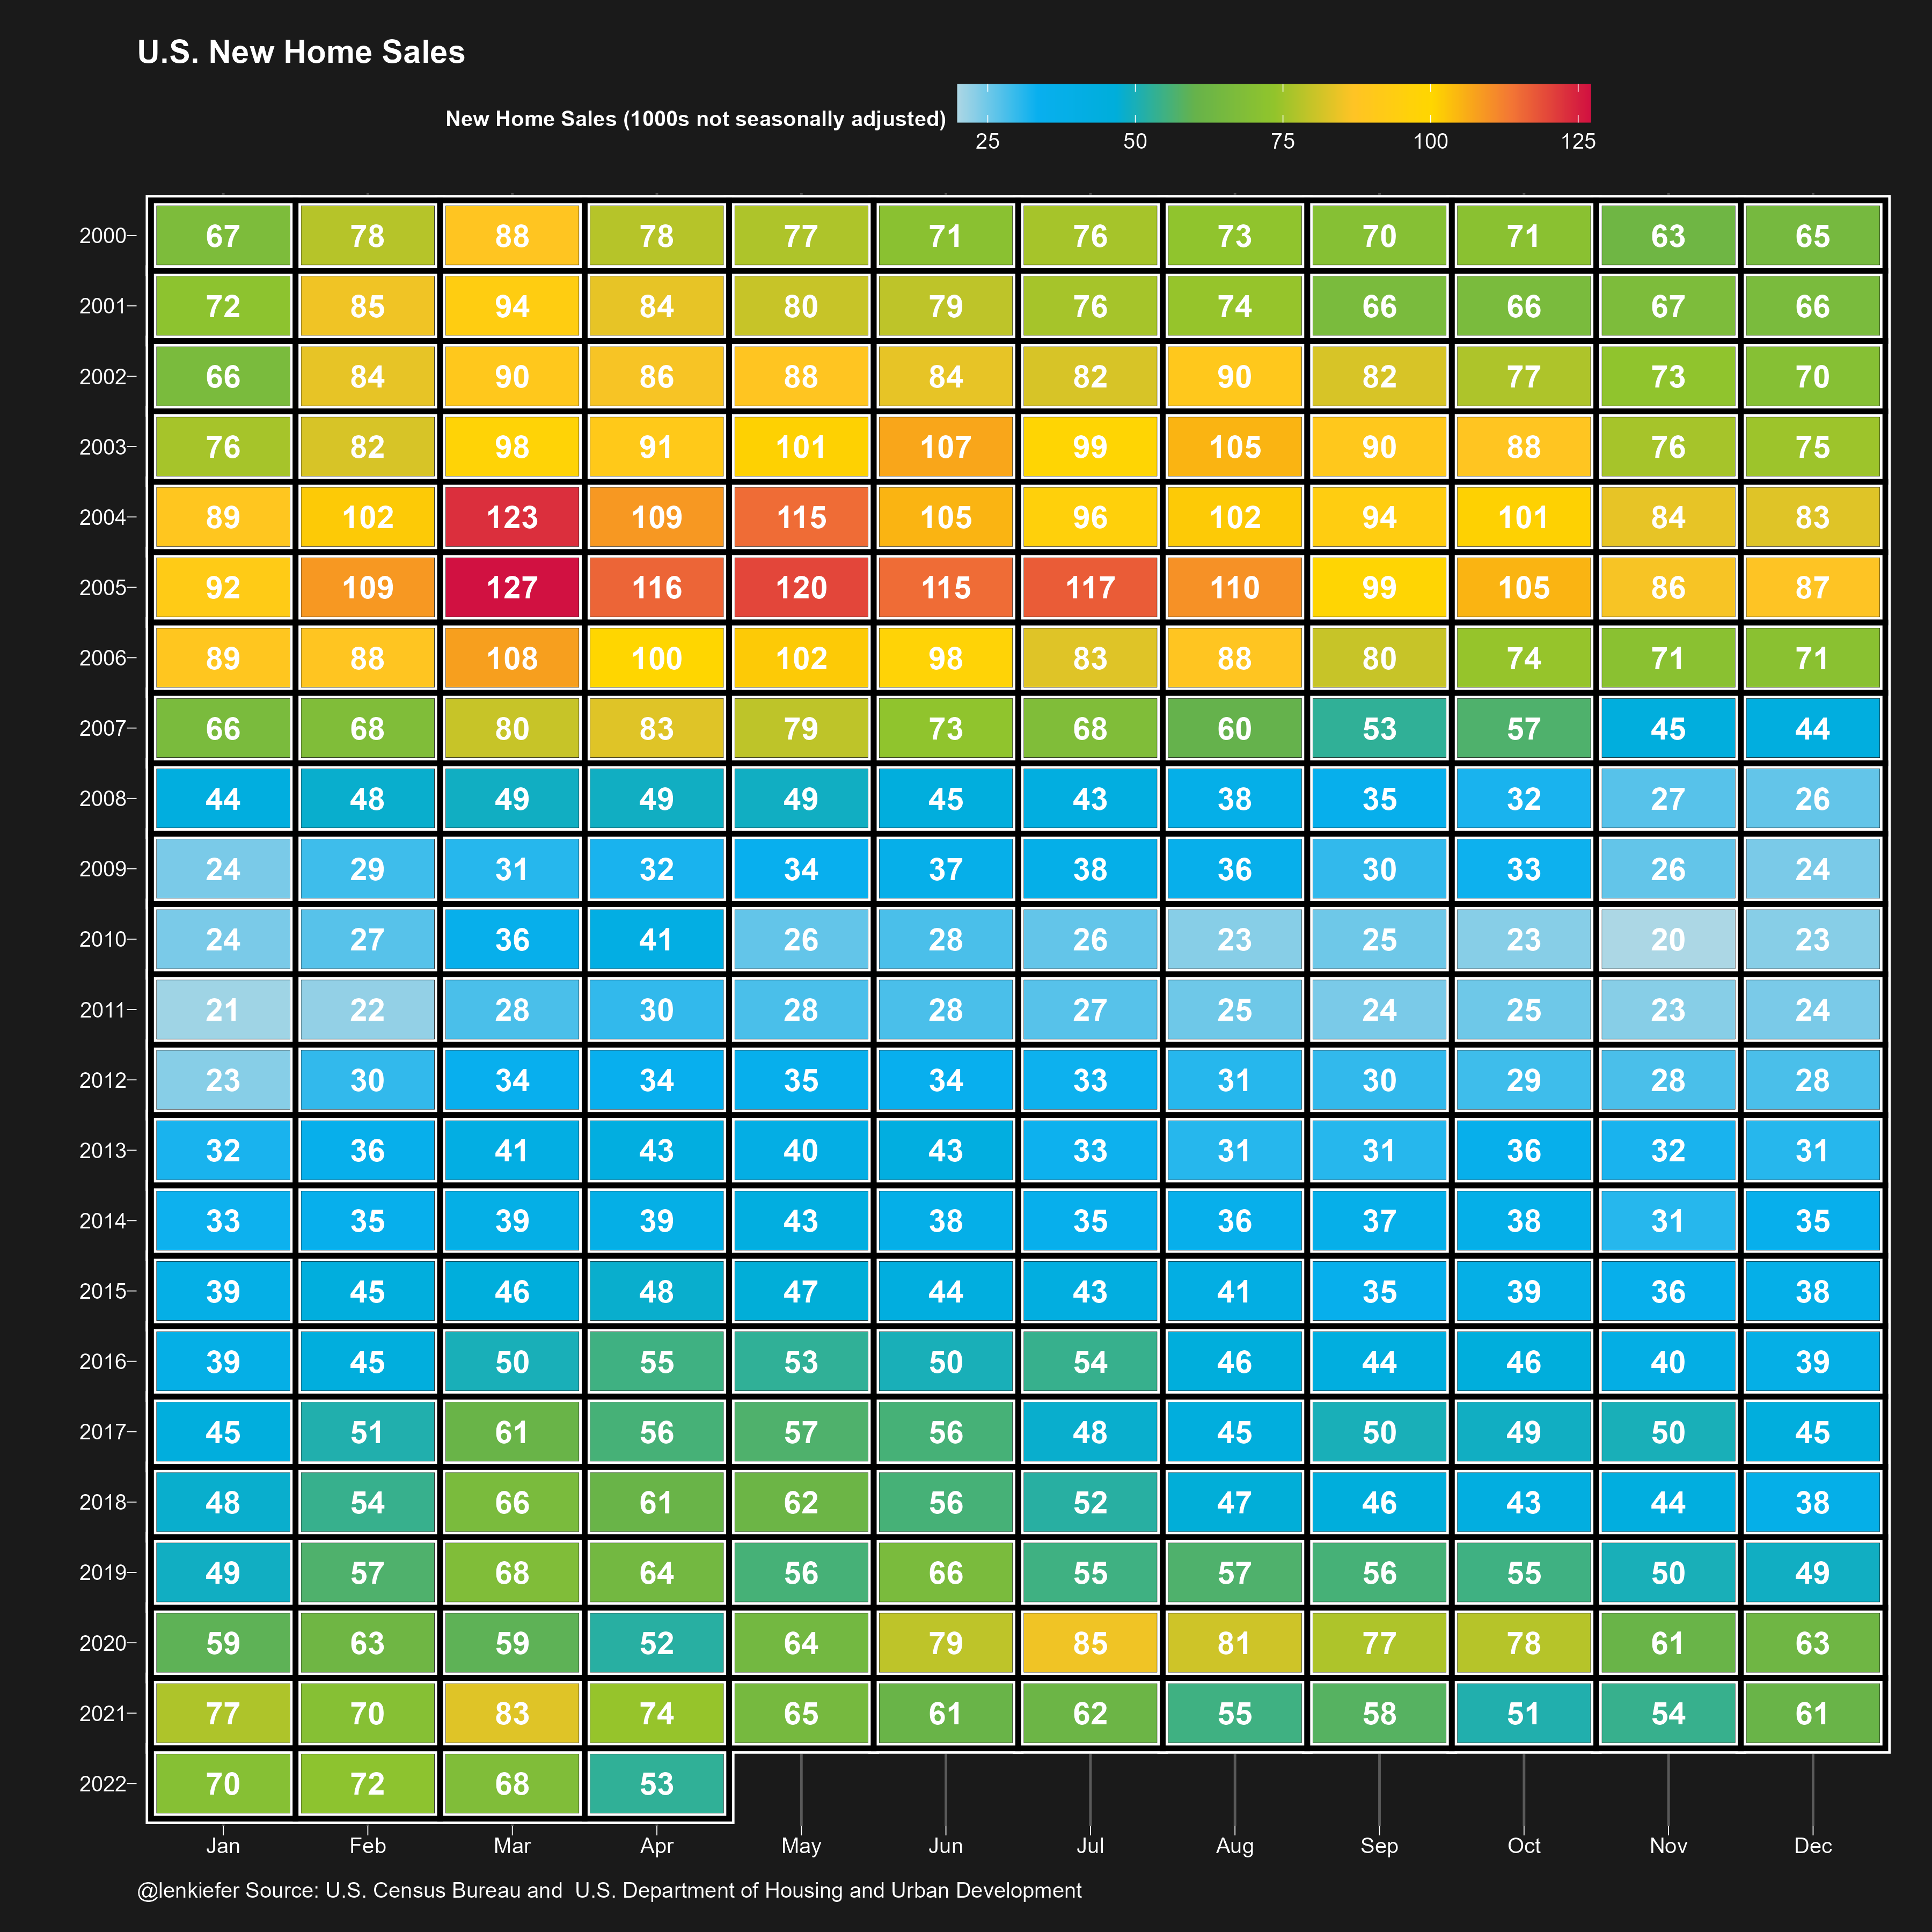
Post: Visualizing uncertainty in housing data
Consumer Price Inflation
Last updated 2020-12-21
Post Visualizing consumer price inflation and mortgage rates