On Twitter Ali Wolf asks a question:
I know there's a stat out there that tracks what % of mortgaged homeowners have a rate below 4%. Does anyone have it or know where to find it?
— Ali Wolf (@AliWolfEcon) November 9, 2021
Mortgage rates, that’s something I know a little about.
Fortunately there is some publicly available data that can answer this question. The National Mortgage Database publishes some aggregate data on outstanding mortgages.
Using a snippet of R code I picked up from Jonathan Regenstein:
NY Fed inflation expectations dropped today. here's the #rstats code to download and chart from the @NYFedResearch website pic.twitter.com/dQui0t4Jde
— Jonathan Regenstein (@jkregenstein) September 13, 2021
we can download the data direct from the FHFA website in R and plot our data.
First we can plot the average origination interest rate on outstanding mortgages. The US average is 4% in 2021Q2.
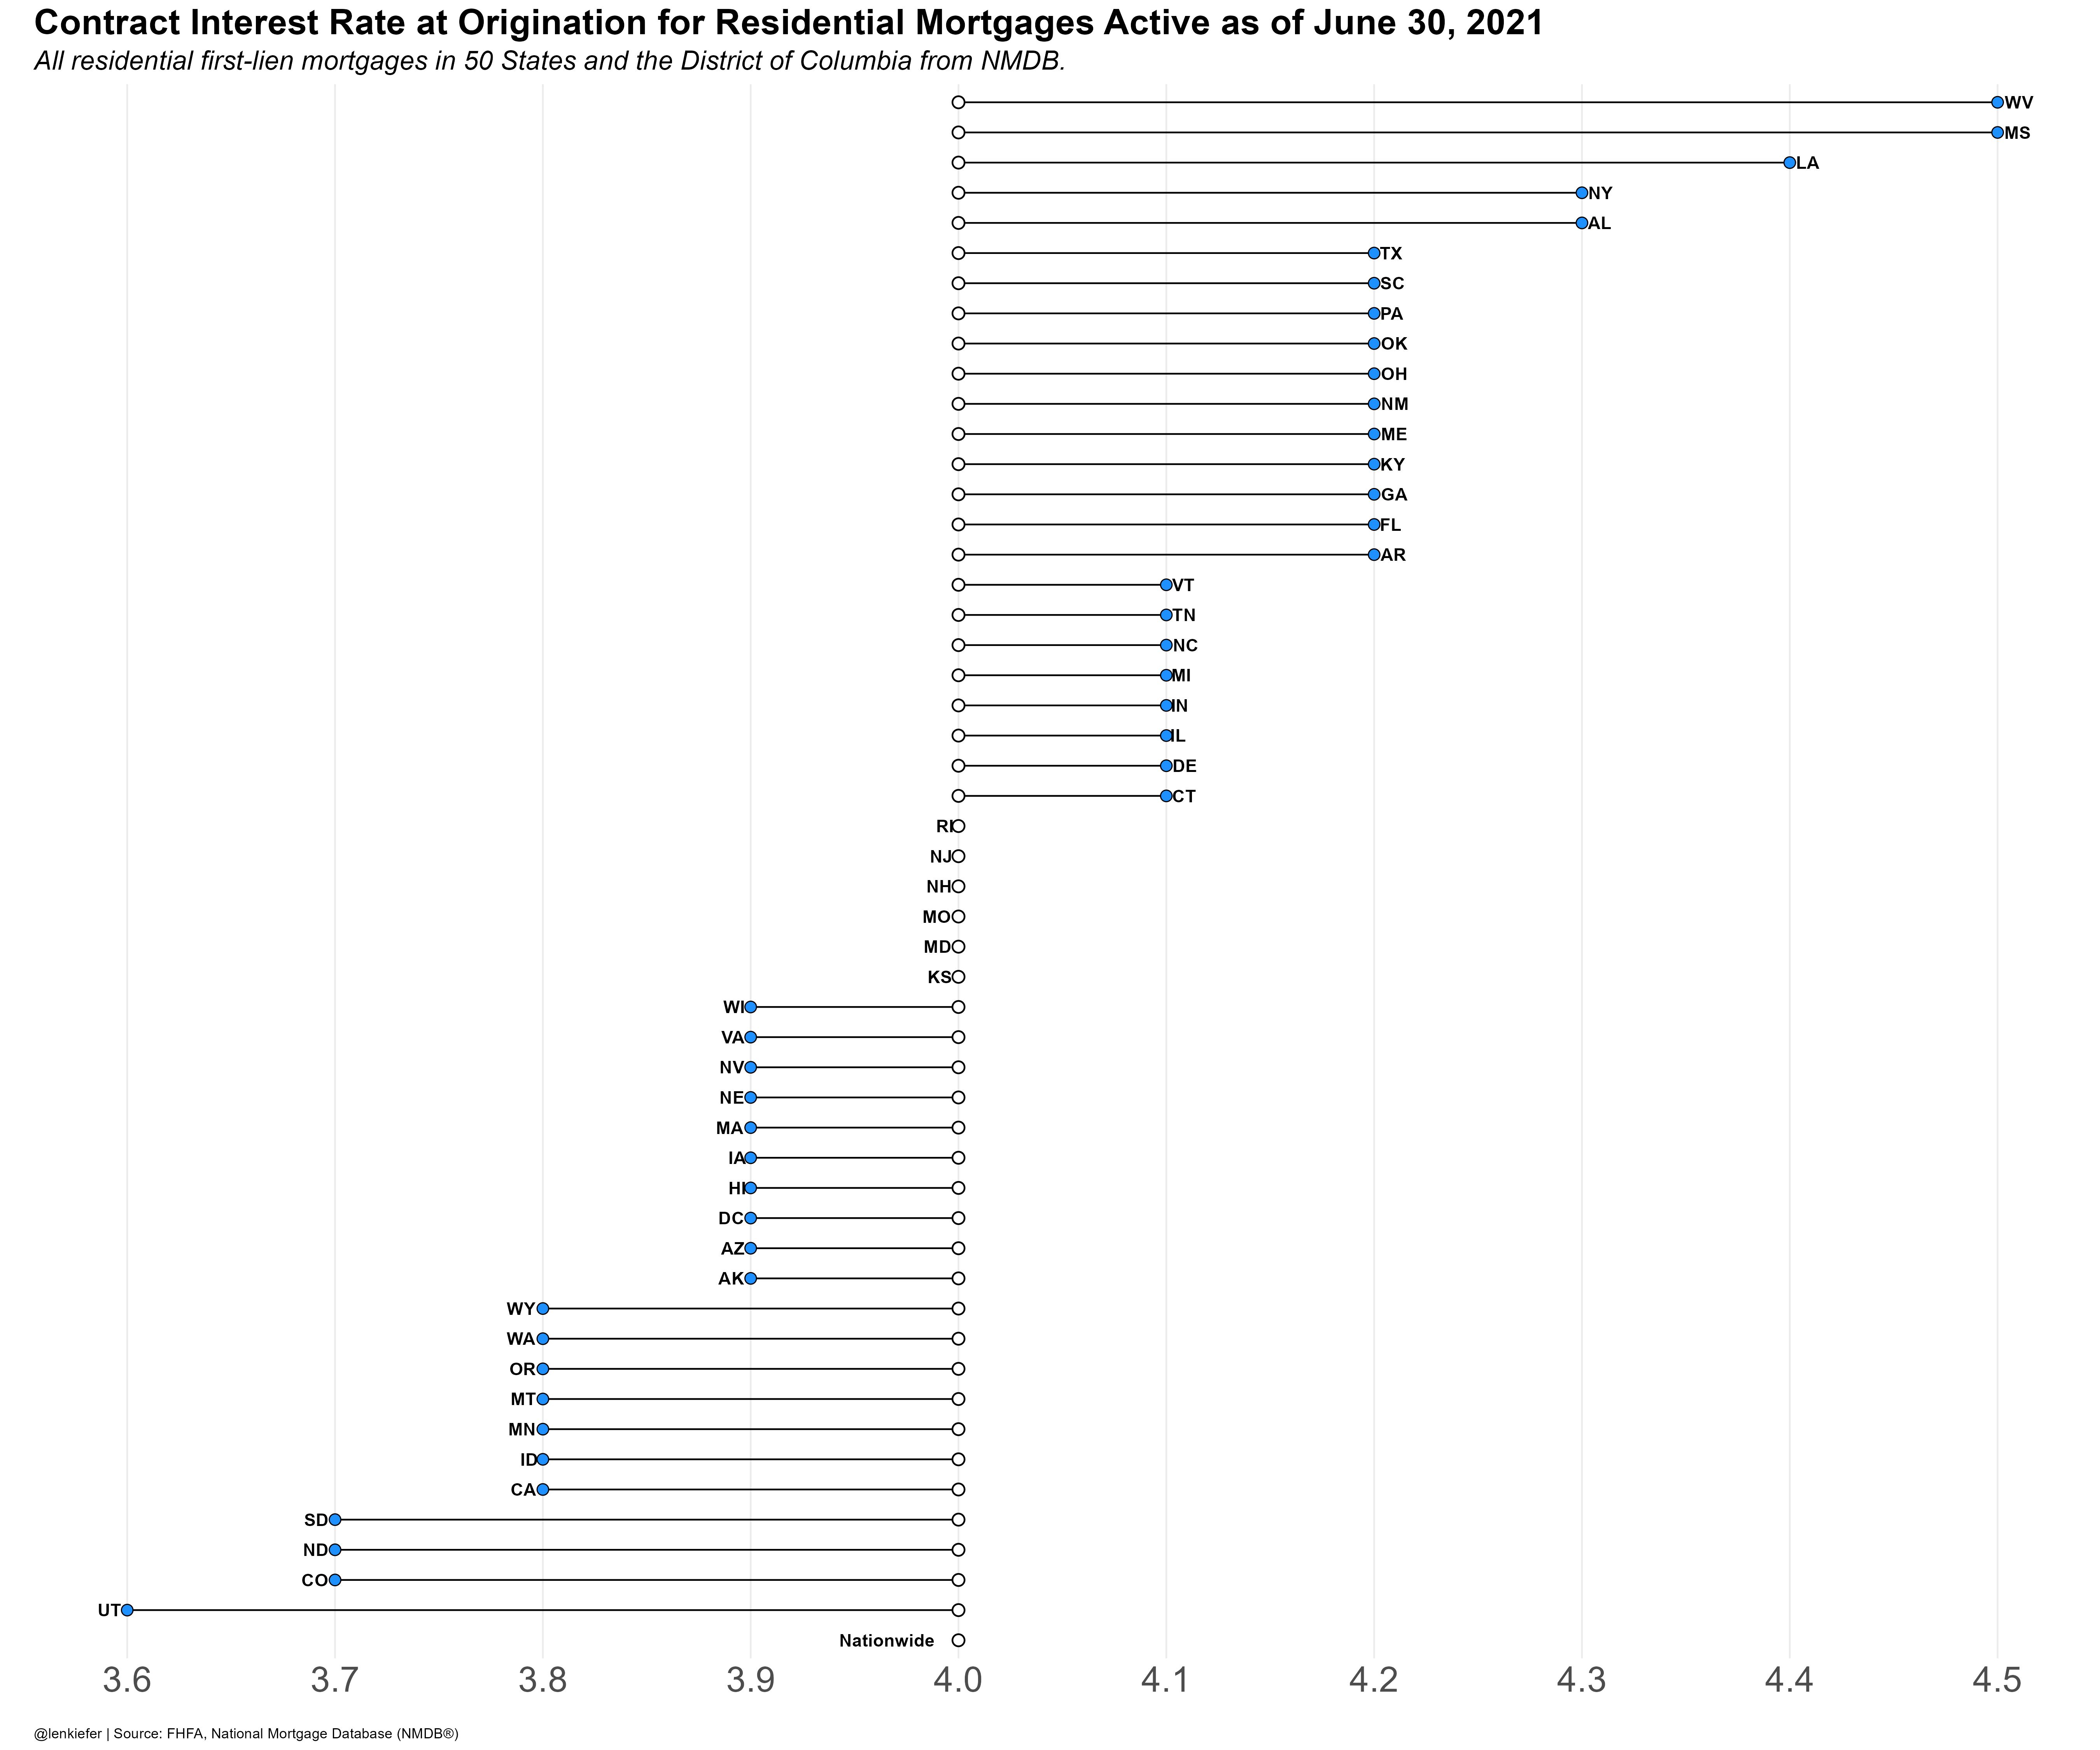
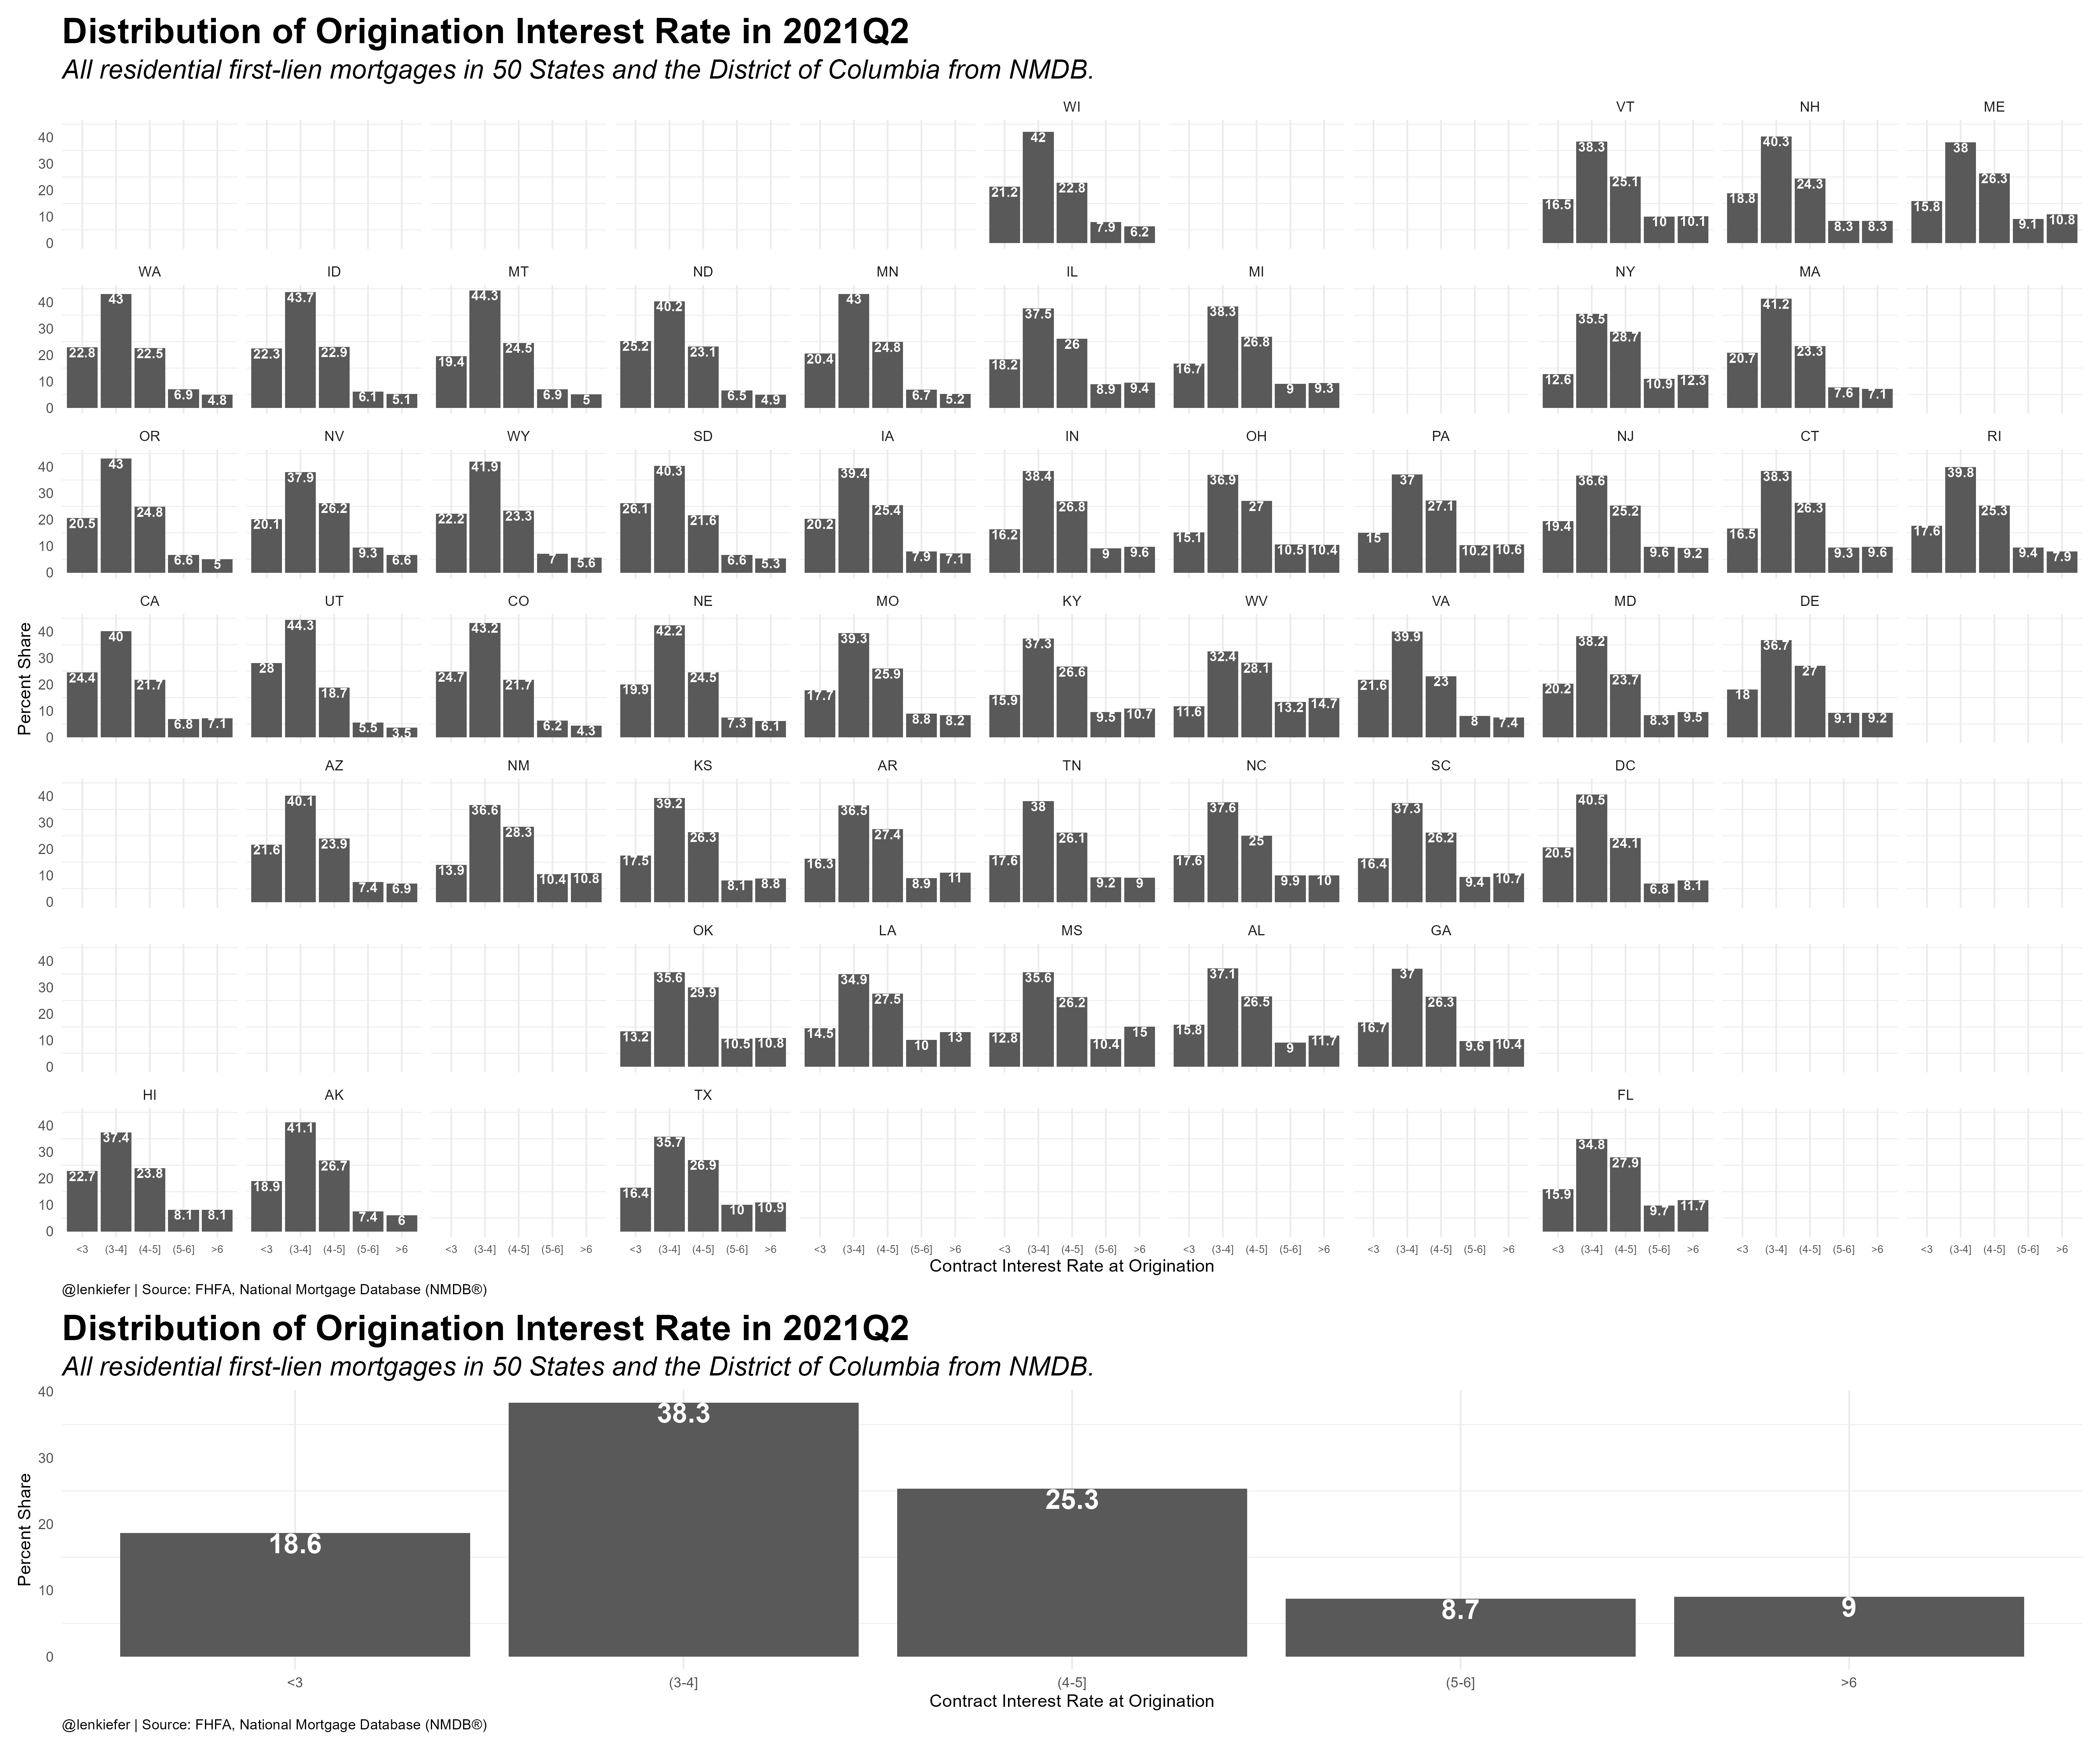
We can also compare the distribution of outstanding rates by state.
Here’s R code for the charts.
library(geofacet)
library(tidyverse)
library(readxl)
library(lubridate)
url1 <-"https://www.fhfa.gov/DataTools/Downloads/Documents/"
url2 <- "NATIONAL-MORTGAGE-DATABASE-(NMDB)-AGGREGATE-DATA/National-State-Statistics-for-Outstanding-Residential-Mortgages-in-the-United-States-2021Q2.xlsx"
destfile <- "nmdb2021Q3.xlsx"
curl::curl_download(paste0(url1,url2),destfile)

nmdb_data <-
  read_excel(destfile,sheet=3,skip=7) %>%
  rename(geo=1,
         avg_rate=11) %>%
  select(geo,avg_rate) %>%
  mutate(id=case_when(geo=="Nationwide"~0,
                      T~avg_rate)) %>%
  mutate(geof=fct_reorder(geo,id))

nmdb_data$us_rate=filter(nmdb_data,geo=="Nationwide")$avg_rate


# First Chart ----#

ggplot(data=nmdb_data,
       aes(y=geof, x=avg_rate))+
  geom_segment(aes(yend=geof,xend=us_rate))+
  geom_point(shape=21, fill="dodgerblue",size=3)+
  geom_point(shape=21, fill="white",aes(x=us_rate),size=3,stroke=0.75)+
  geom_text(aes(label=geo,hjust=ifelse(avg_rate>us_rate,-0.25,1.25)),
            fontface="bold")+
  scale_x_continuous(breaks=seq(3.5,4.5,.1))+
  theme_minimal()+
  theme(legend.position="top",
        legend.key.width=unit(2,"cm"),
        plot.caption=element_text(hjust=0),
        axis.text=element_text(size=rel(2)),
        axis.text.y=element_blank(),
        panel.grid.minor.x=element_blank(),
        panel.grid.major.y=element_blank(),
        plot.background = element_rect(fill="white",color=NA),
        panel.background = element_rect(fill="white",color=NA),
        plot.subtitle=element_text(face="italic",size=rel(1.5)),
        plot.title=element_text(size=rel(2),face="bold"))+
  labs(x="",y="",
       title="Contract Interest Rate at Origination for Residential Mortgages Active as of June 30, 2021",
       subtitle="All residential first-lien mortgages in 50 States and the District of Columbia from NMDB.",
       caption="@lenkiefer | Source: FHFA, National Mortgage Database (NMDB®)")


nmdb_data2 <-
  read_excel(destfile,sheet=3,skip=7) %>%
  rename(geo=1,
         lt3=12,
         b34=13,
         b45=14,
         b56=15,
         gt6=16) %>%
  select(geo,lt3,b34,b45,b56,gt6) %>%
  pivot_longer(cols=-geo)

nmdb_data2 <- mutate(nmdb_data2,
                     rf=factor(name,levels=c("lt3","b34","b45","b56","gt6")))

# Second Chart ----#

gmap1 <-
ggplot(data=nmdb_data2,aes(x=rf,y=value))+geom_col()+facet_geo(~geo)+
  scale_x_discrete(labels=c("<3","(3-4]", "(4-5]","(5-6]", ">6"))+
  geom_text(aes(label=value),color="white",vjust=1,fontface="bold",size=3)+
  theme_minimal()+
  theme(legend.position="top",
        legend.key.width=unit(2,"cm"),
        plot.caption=element_text(hjust=0),
        axis.text.x=element_text(size=rel(0.75)),
        panel.grid.minor.x=element_blank(),
        panel.grid.major.y=element_blank(),
        plot.background = element_rect(fill="white",color=NA),
        panel.background = element_rect(fill="white",color=NA),
        plot.subtitle=element_text(face="italic",size=rel(1.5)),
        plot.title=element_text(size=rel(2),face="bold"))+
  labs(title="Distribution of Origination Interest Rate in 2021Q2",
       x="Contract Interest Rate at Origination",
       y="Percent Share",
       subtitle="All residential first-lien mortgages in 50 States and the District of Columbia from NMDB.",
       caption="@lenkiefer | Source: FHFA, National Mortgage Database (NMDB®)")

gbar2<-
  ggplot(data=filter(nmdb_data2,geo=="Nationwide"),aes(x=rf,y=value))+geom_col()+
  geom_text(aes(label=value),color="white",vjust=1,fontface="bold",size=6)+
  scale_x_discrete(labels=c("<3","(3-4]", "(4-5]","(5-6]", ">6"))+
  theme_minimal()+
  theme(legend.position="top",
        legend.key.width=unit(2,"cm"),
        plot.caption=element_text(hjust=0),
        axis.text.x=element_text(size=rel(1)),
        panel.grid.minor.x=element_blank(),
        panel.grid.major.y=element_blank(),
        plot.background = element_rect(fill="white",color=NA),
        panel.background = element_rect(fill="white",color=NA),
        plot.subtitle=element_text(face="italic",size=rel(1.5)),
        plot.title=element_text(size=rel(2),face="bold"))+
  labs(title="Distribution of Origination Interest Rate in 2021Q2",
       x="Contract Interest Rate at Origination",
       y="Percent Share",
       subtitle="All residential first-lien mortgages in 50 States and the District of Columbia from NMDB.",
       caption="@lenkiefer | Source: FHFA, National Mortgage Database (NMDB®)")

gmap1/gbar2+plot_layout(heights=c(4,1))