I want to share with you a fun rose chart. No not the Nightingale chart (see Jeff Shaffer). Rather we’re talking about a cool generative chart, that fit in a tweet from @aschinchon [https://twitter.com/aschinchon] :
#rose
— Antonio Sánchez Chinchón (@aschinchon) June 16, 2021
library(tidyverse)
seq(-3,3,by=.01) %>%
expand.grid(x=., y=.) %>%
ggplot(aes(x=(1-x-sin(y^2)), y=(1+y-cos(x^2)))) +
geom_point(alpha=.05, shape=20, size=0)+
theme_void()+
coord_polar()#rtistry #rstats #Maths #generativeart pic.twitter.com/vAVeQU0K2o
I was inspired to use ggfx to add some features.
A little bit of setup:
library(tidyverse)
library(ggfx)
Original chart from the tweet
seq(-3,3,by=.01) %>%
  expand.grid(x=., y=.) %>%
  ggplot(aes(x=(1-x-sin(y^2)), y=(1+y-cos(x^2)))) +
  geom_point(alpha=.05, shape=20, size=0)+
  theme_void()+
  coord_polar()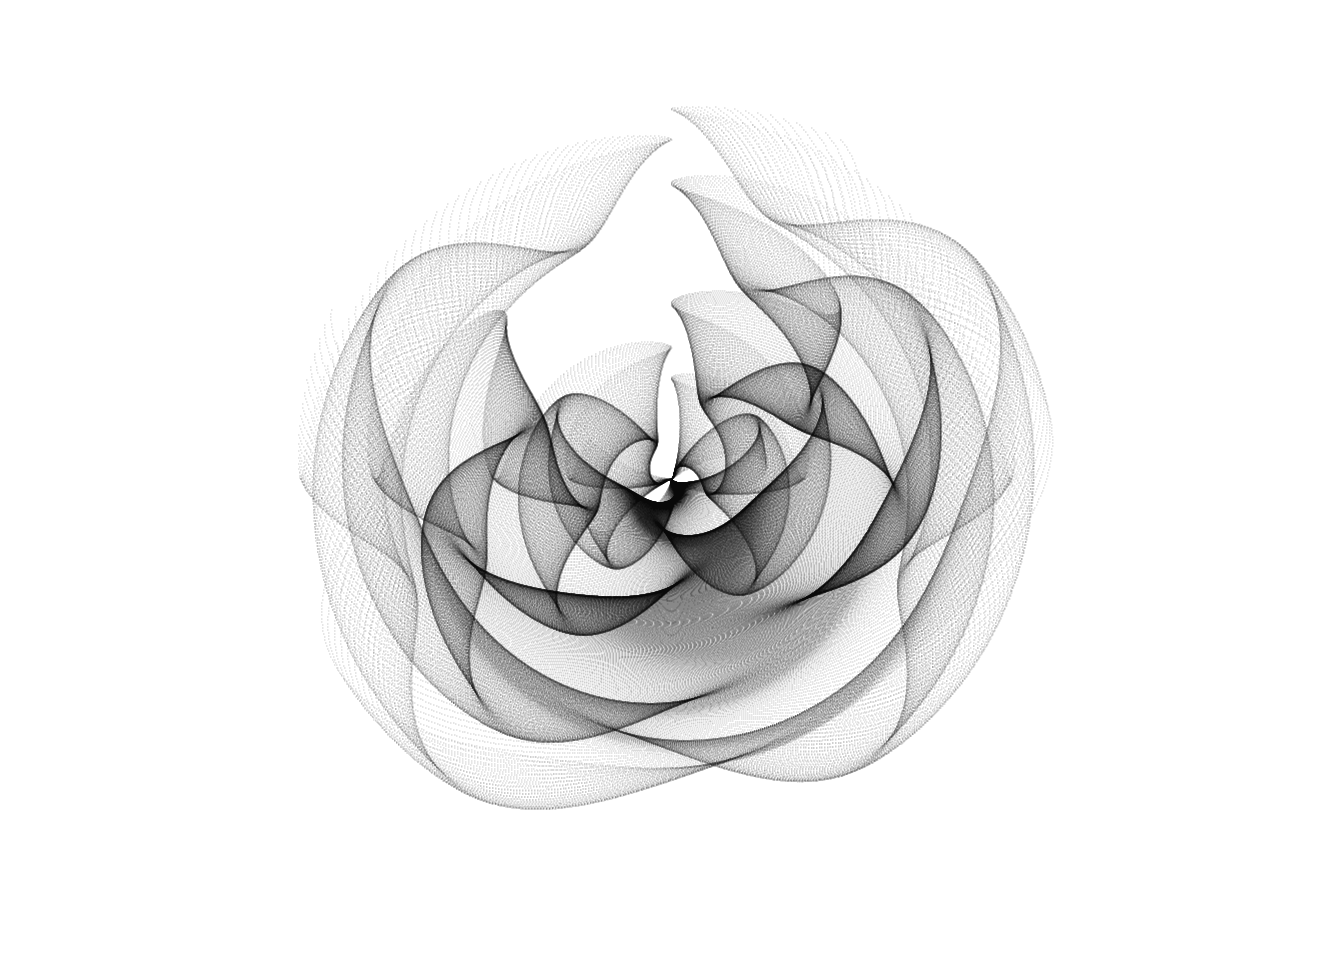
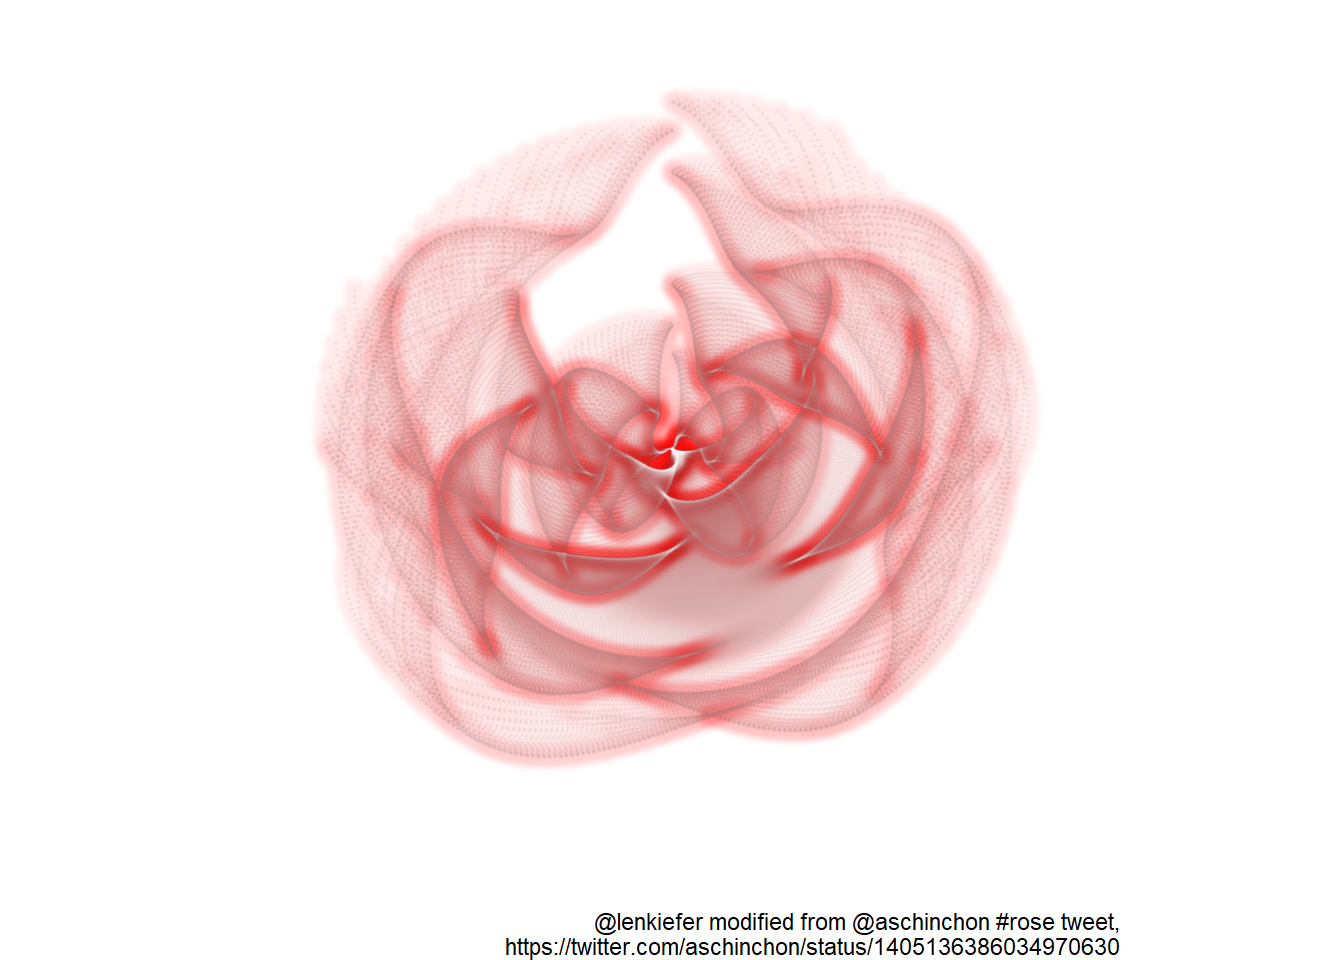
I made my own tweet-sized remix
seq(-3, 3, by = .02) %>%
  expand.grid(x = ., y = .) %>%
  ggplot(aes(x = (1 - x - sin(y ^ 2)), y = (1 + y - cos(x ^ 2)))) +
  ggfx::with_outer_glow(
    geom_point(
      alpha = .05,
      shape = 20,
      size = 0,
      color = "white"
    ),
    colour = "red",
    expand = 10,
    sigma = 3
  ) +
  theme_void() +
  coord_polar() +
  labs(
    caption = paste0(
      "@lenkiefer modified from @aschinchon #rose tweet,",
      "\nhttps://twitter.com/aschinchon/status/1405136386034970630"
    )
  )
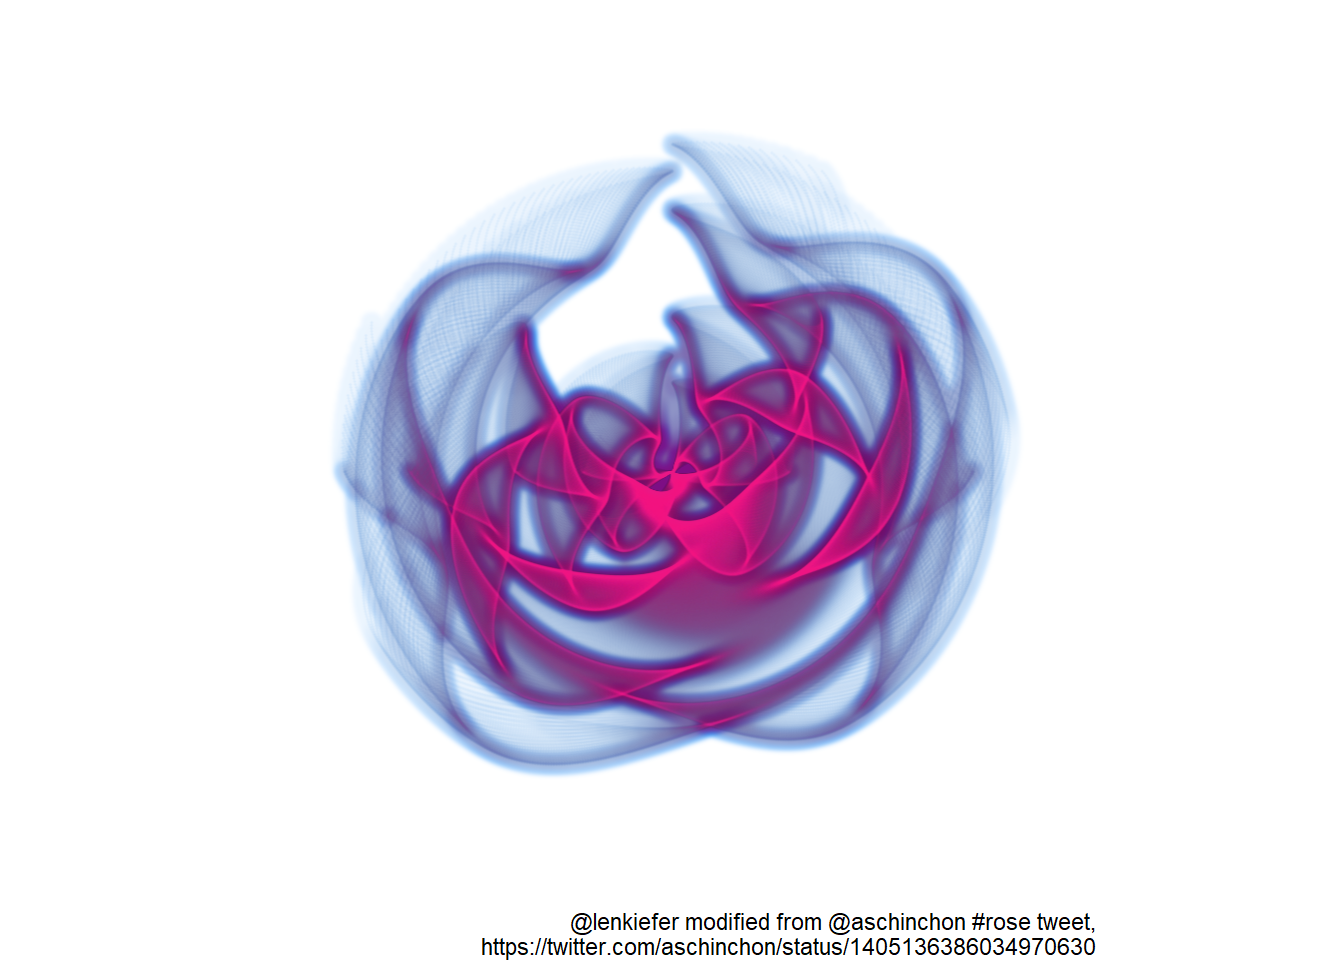
Then tried a few other permutations of colors and ggfx effects.
seq(-3, 3, by = .01) %>%
  expand.grid(x = ., y = .) %>%
  ggplot(aes(x = (1 - x - sin(y ^ 2)), y = (1 + y - cos(x ^ 2)))) +
  ggfx::with_inner_glow(
    colour = "dodgerblue",
    expand = 5,
    sigma =2,
    ggfx::with_outer_glow(
      geom_point(
        alpha = .05,
        shape = 20,
        size = 0,
        color = "deeppink"
      ),
      colour = "purple",
      expand = 10,
      sigma = 2
    )
  ) +
  theme_void() +
  coord_polar() +
  labs(
    caption = paste0(
      "@lenkiefer modified from @aschinchon #rose tweet,",
      "\nhttps://twitter.com/aschinchon/status/1405136386034970630"
    ),
    title = ""
  )
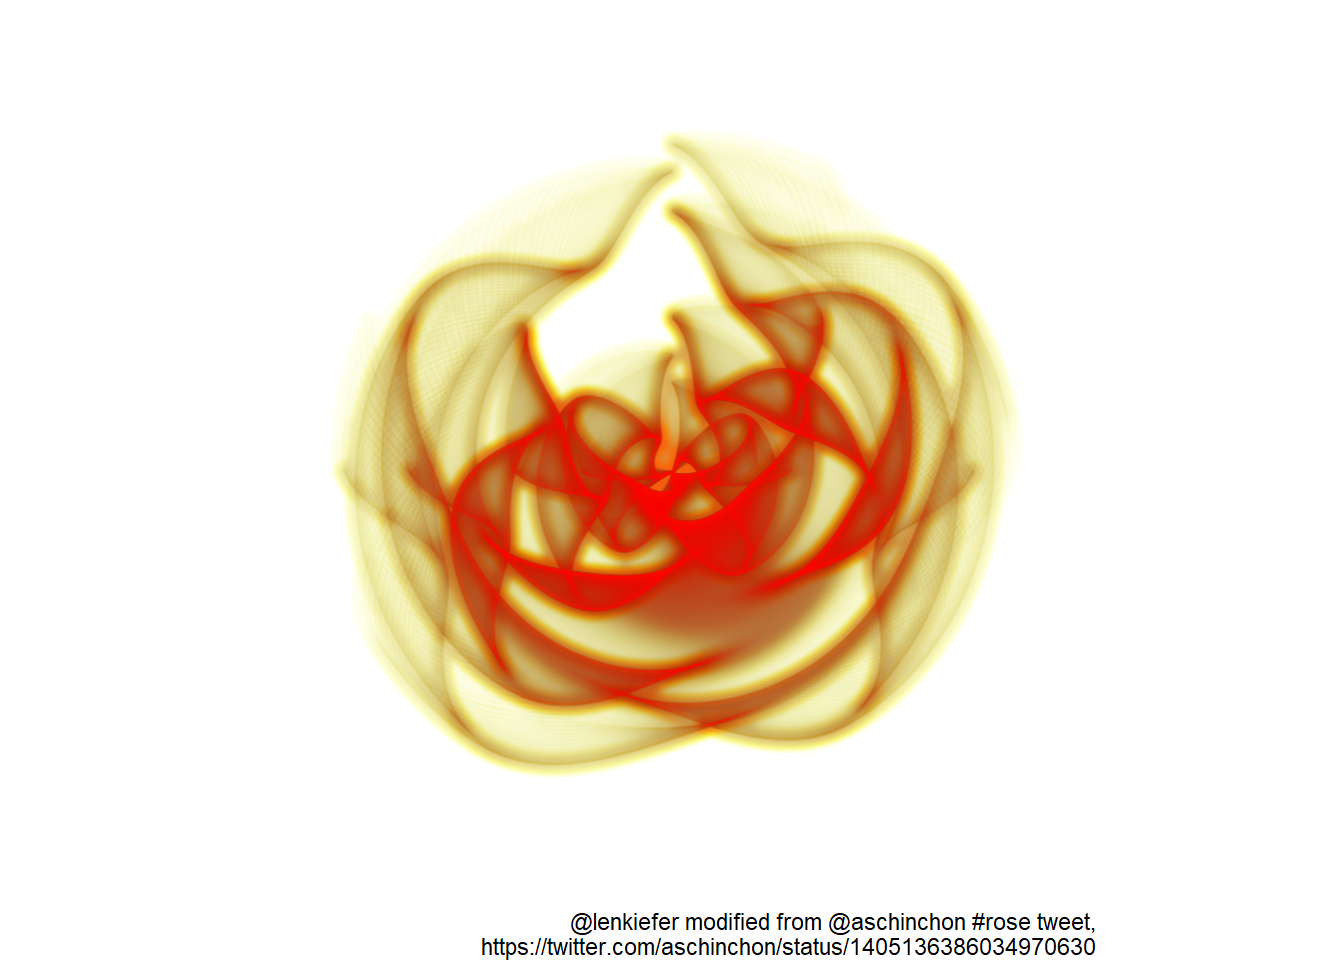
seq(-3, 3, by = .01) %>%
  expand.grid(x = ., y = .) %>%
  ggplot(aes(x = (1 - x - sin(y ^ 2)), y = (1 + y - cos(x ^ 2)))) +
  ggfx::with_inner_glow(
    colour = "yellow",
    expand = 5,
    sigma = 2,
    ggfx::with_outer_glow(
      geom_point(
        alpha = .05,
        shape = 20,
        size = 0,
        color = "red"
      ),
      colour = "#fe5305",
      expand = 10,
      sigma = 2
    )
  ) +
  theme_void() +
  coord_polar() +
  labs(
    caption = paste0(
      "@lenkiefer modified from @aschinchon #rose tweet,",
      "\nhttps://twitter.com/aschinchon/status/1405136386034970630"
    ),
    title = ""
  )