Last week the U.S. Commerce Department reported the advance estimate for annual economic growth for 2020. For the full year, US gross domestic product contracted 3.5 percentage points, the largest annual decline since the 11.6 percentage point contraction in 1946. The similarities pretty much end there.
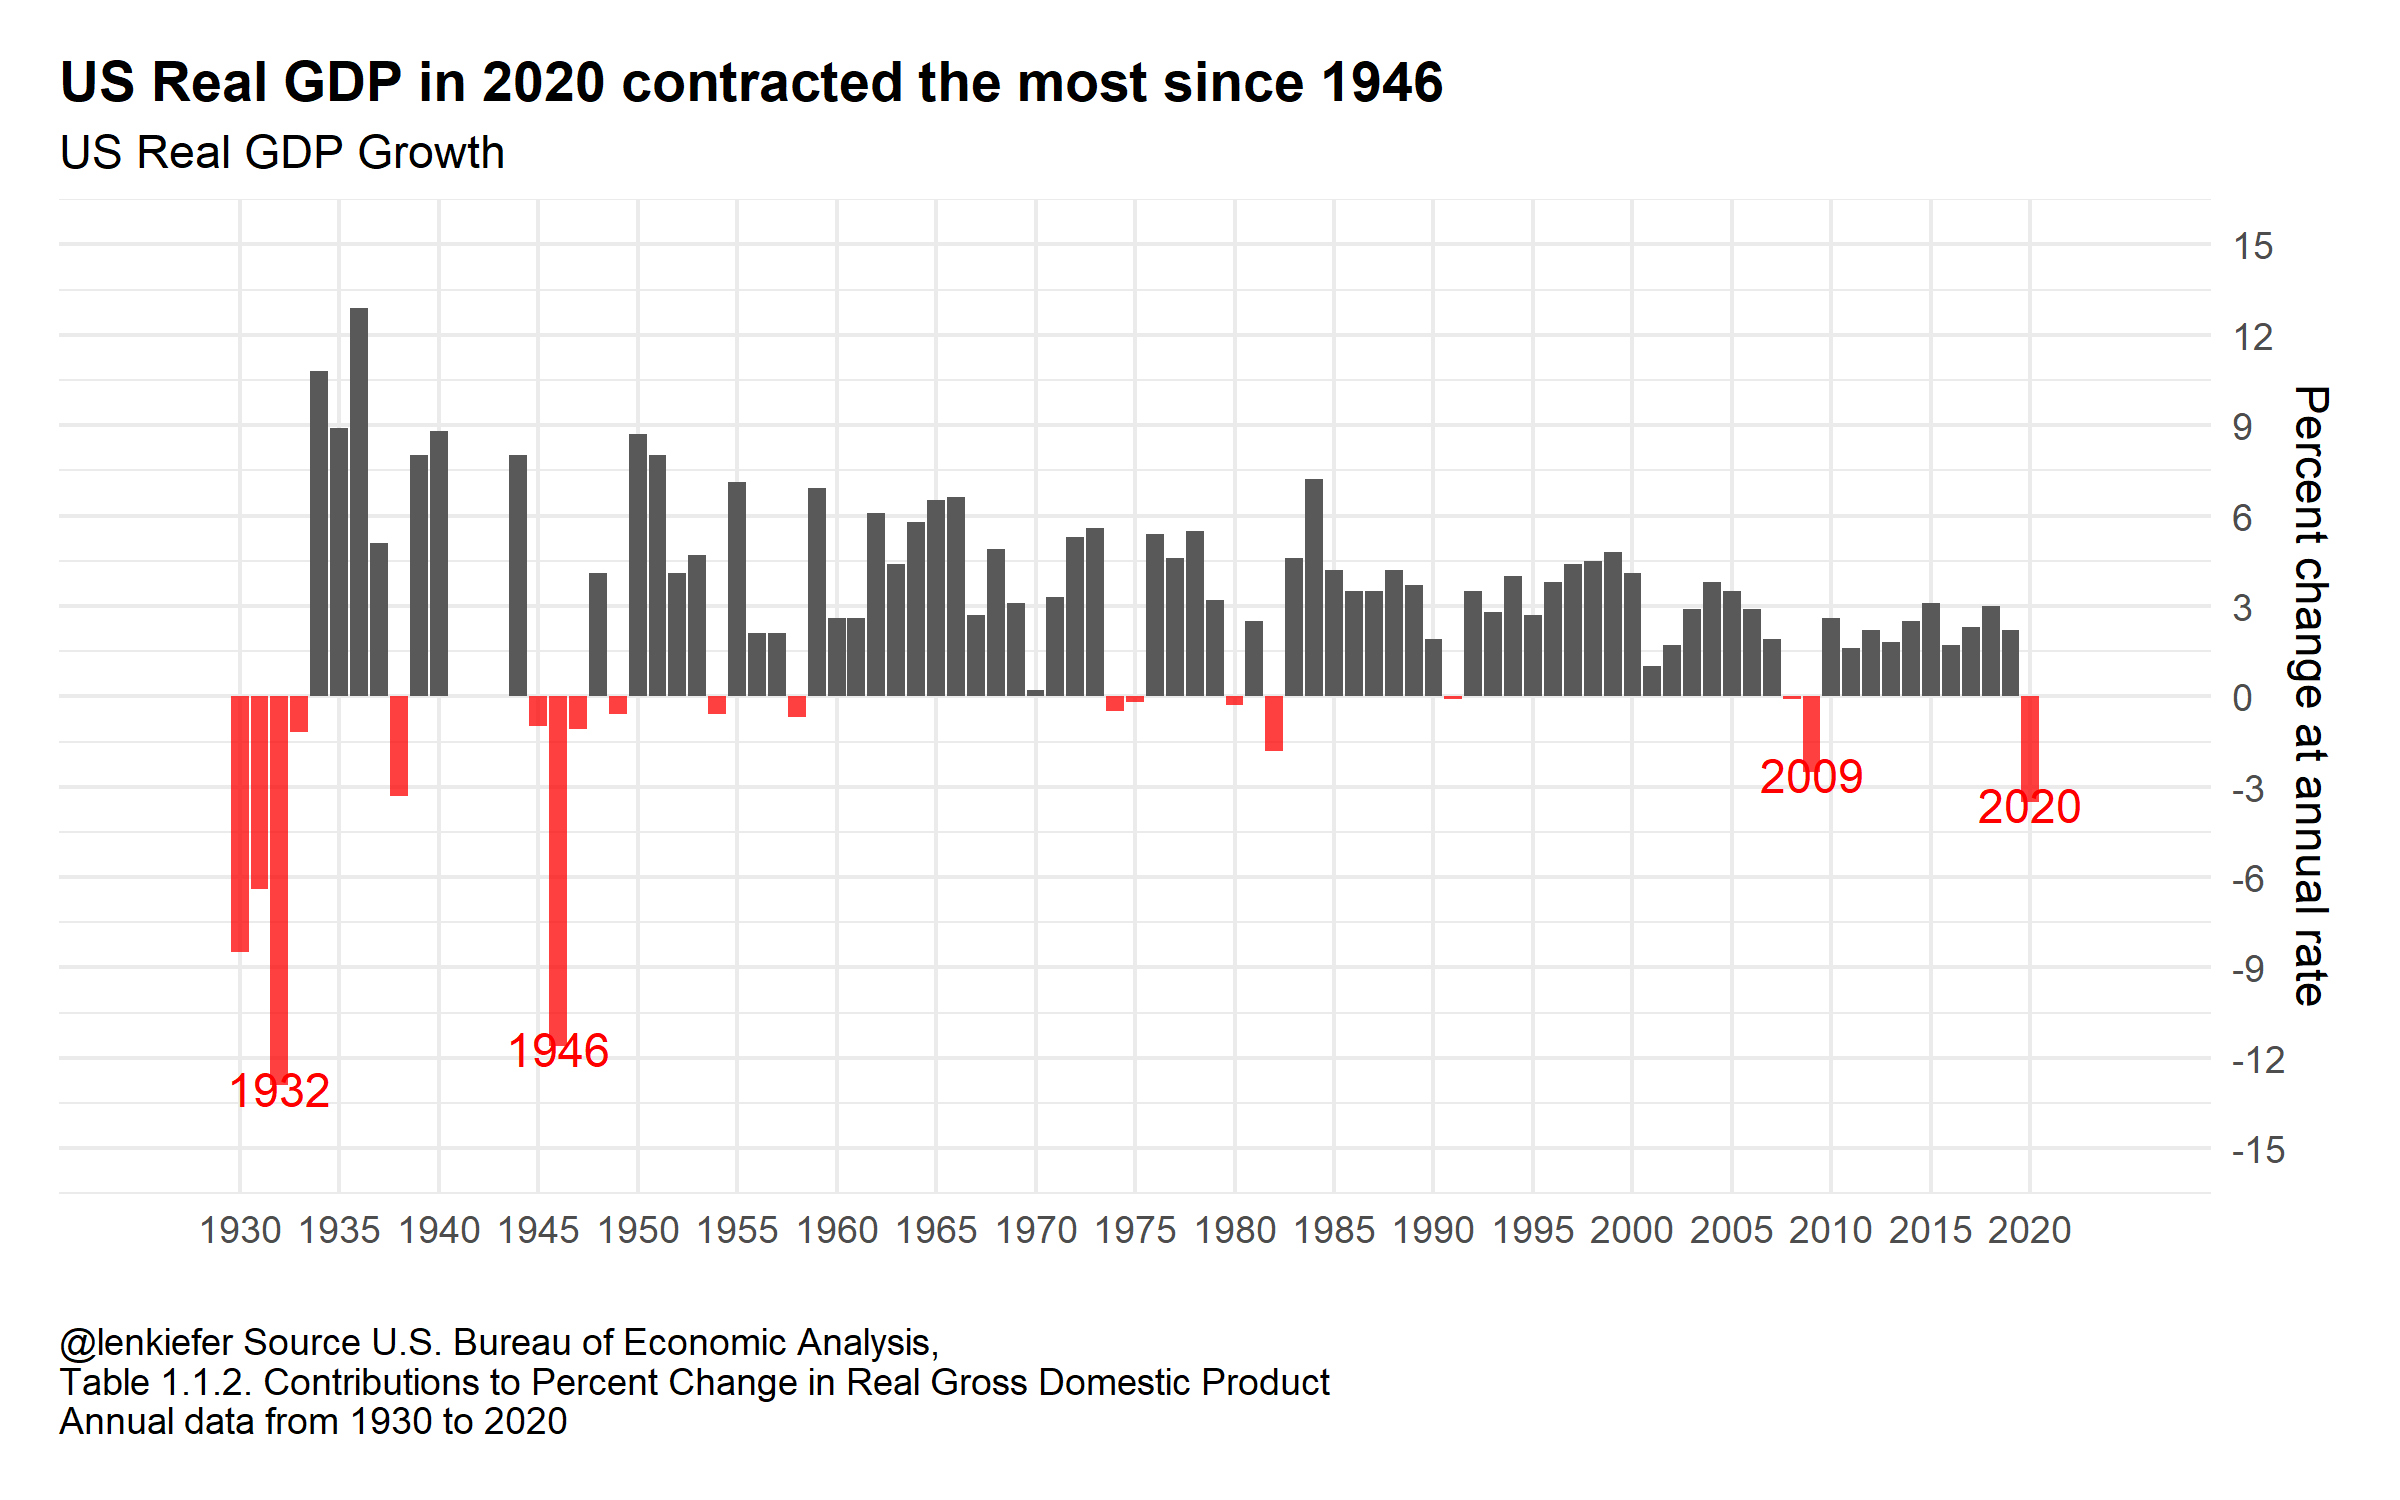
In 1946 the US economy was demobilizing after finishing the fight against fascism. Factories were shuttered that had been producing munitions, fighter planes, tanks and liberty ships, while the G.I.s returned to a labor market forever changed by the mobilization for total war. The 11.6 percentage point contraction from 1945 to 1946 was more than 100% driven by reductions in national defense expenditures.
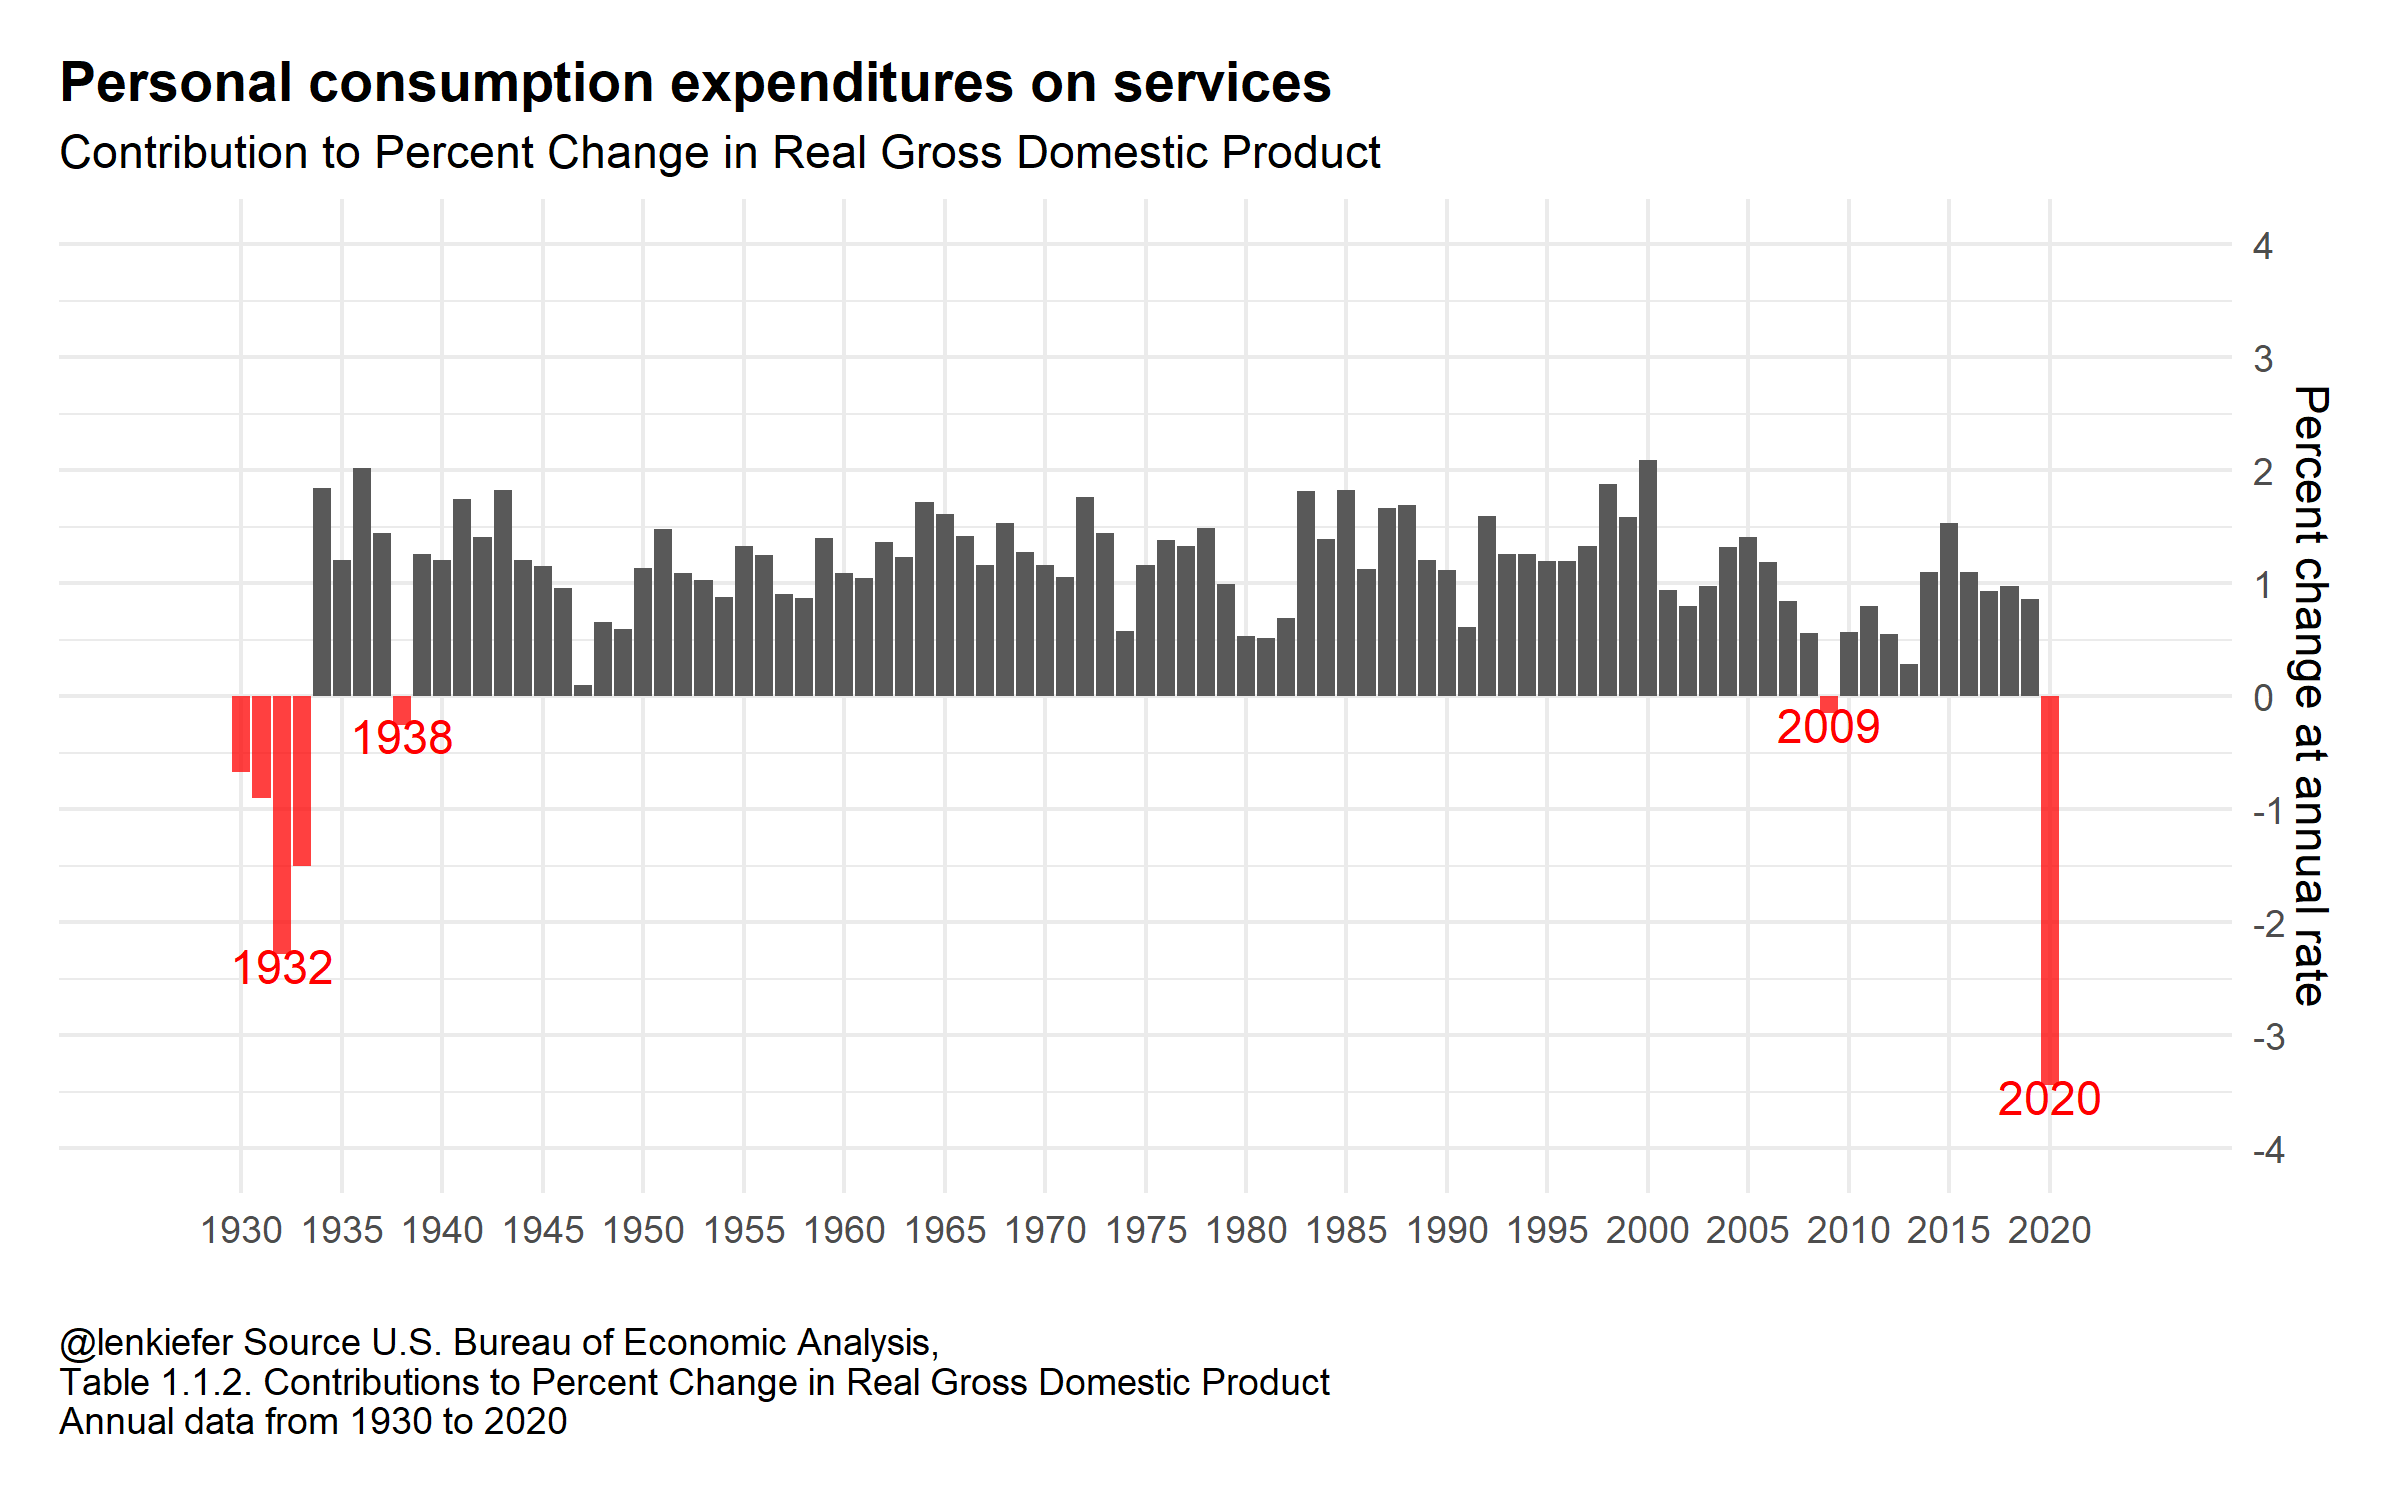
In 2020 the US economy was demobilized to continue the fight against the coronavirus pandemic. As businesses were shuttered to impose social distancing, consumer spending plummeted. Nearly all of the 3.5 percentage point decline in real GDP could be attributed to falling personal consumption expenditures on services. This decline took place almost entirely in the second quarter, and while the economy has recovered somewhat the pace of recovery slowed in the fourth quarter.
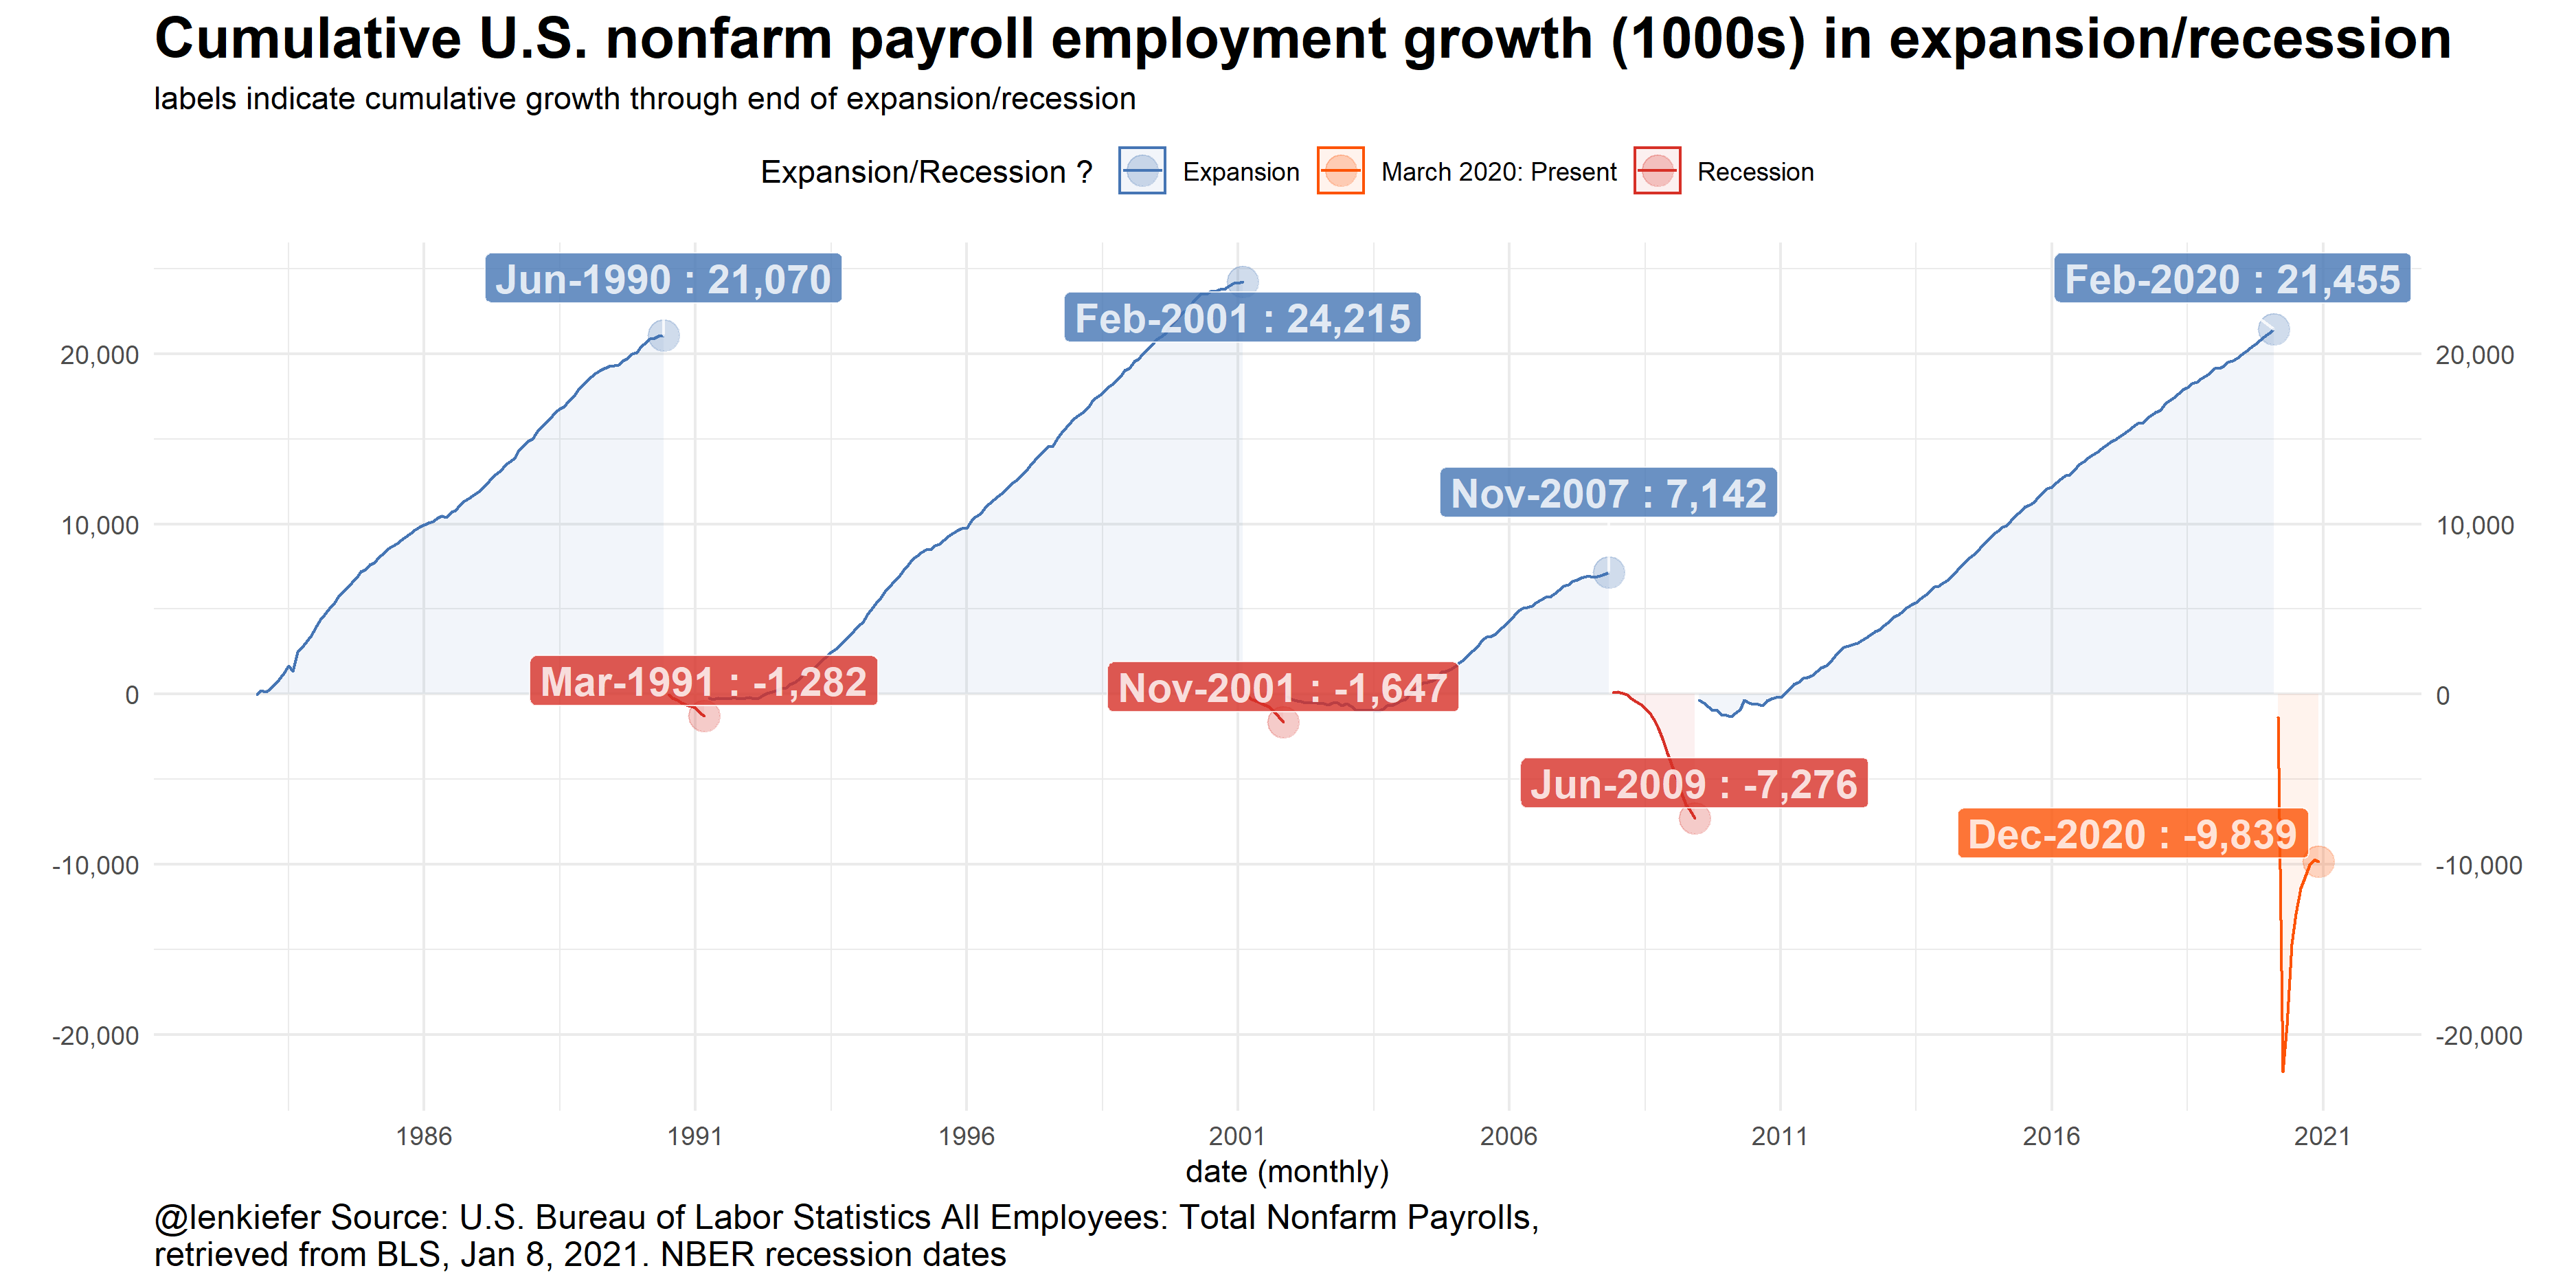
An enormous gap remains to be filled. Payroll employment as of December is still down nearly 10 million jobs from February of 2020, more than 2 million more job losses than the total during the Great Recession.
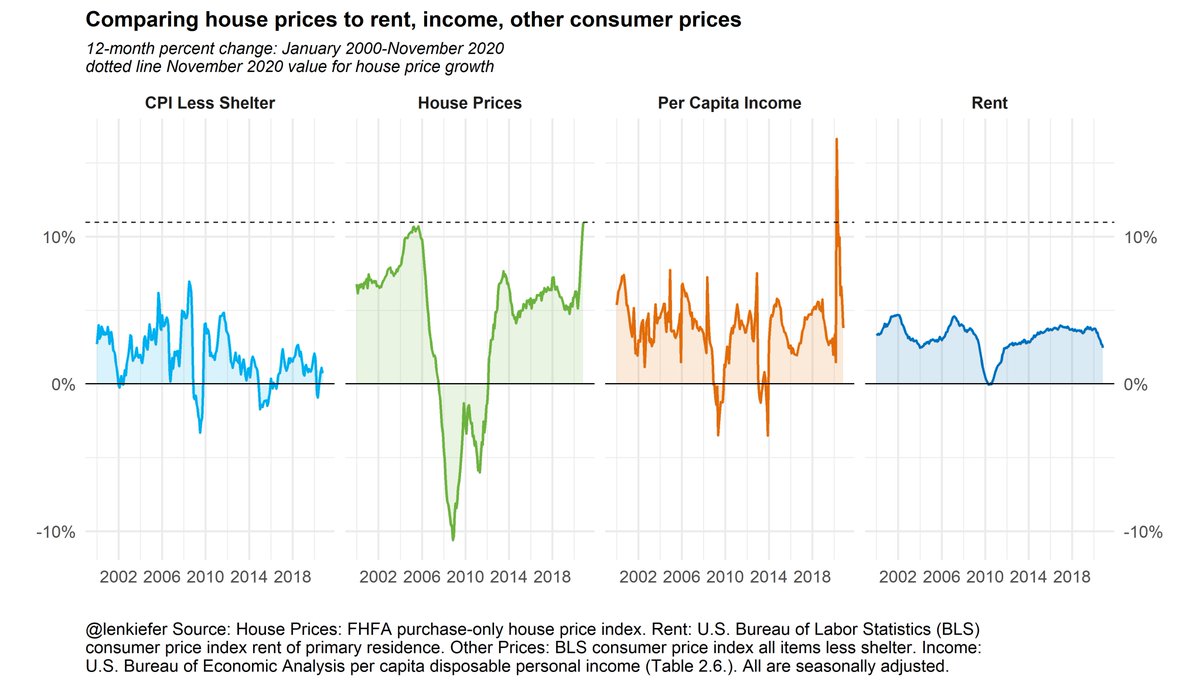
Despite these enormous challenges facing the economy, the single-family owned segment of the housing market remains on fire. Last week the FHFA released their house price index for November, which showed that the 12-month rate of growth in the national house price surpassed the peak growth rate reached during the height of the housing boom. The Freddie Mac House Price Index for December did not reach the highs for 12-month growth that it reached during the housing boom, but it’s pretty close. House prices increased over 10 percent year-over- year and growth accelerated in the fourth quarter.
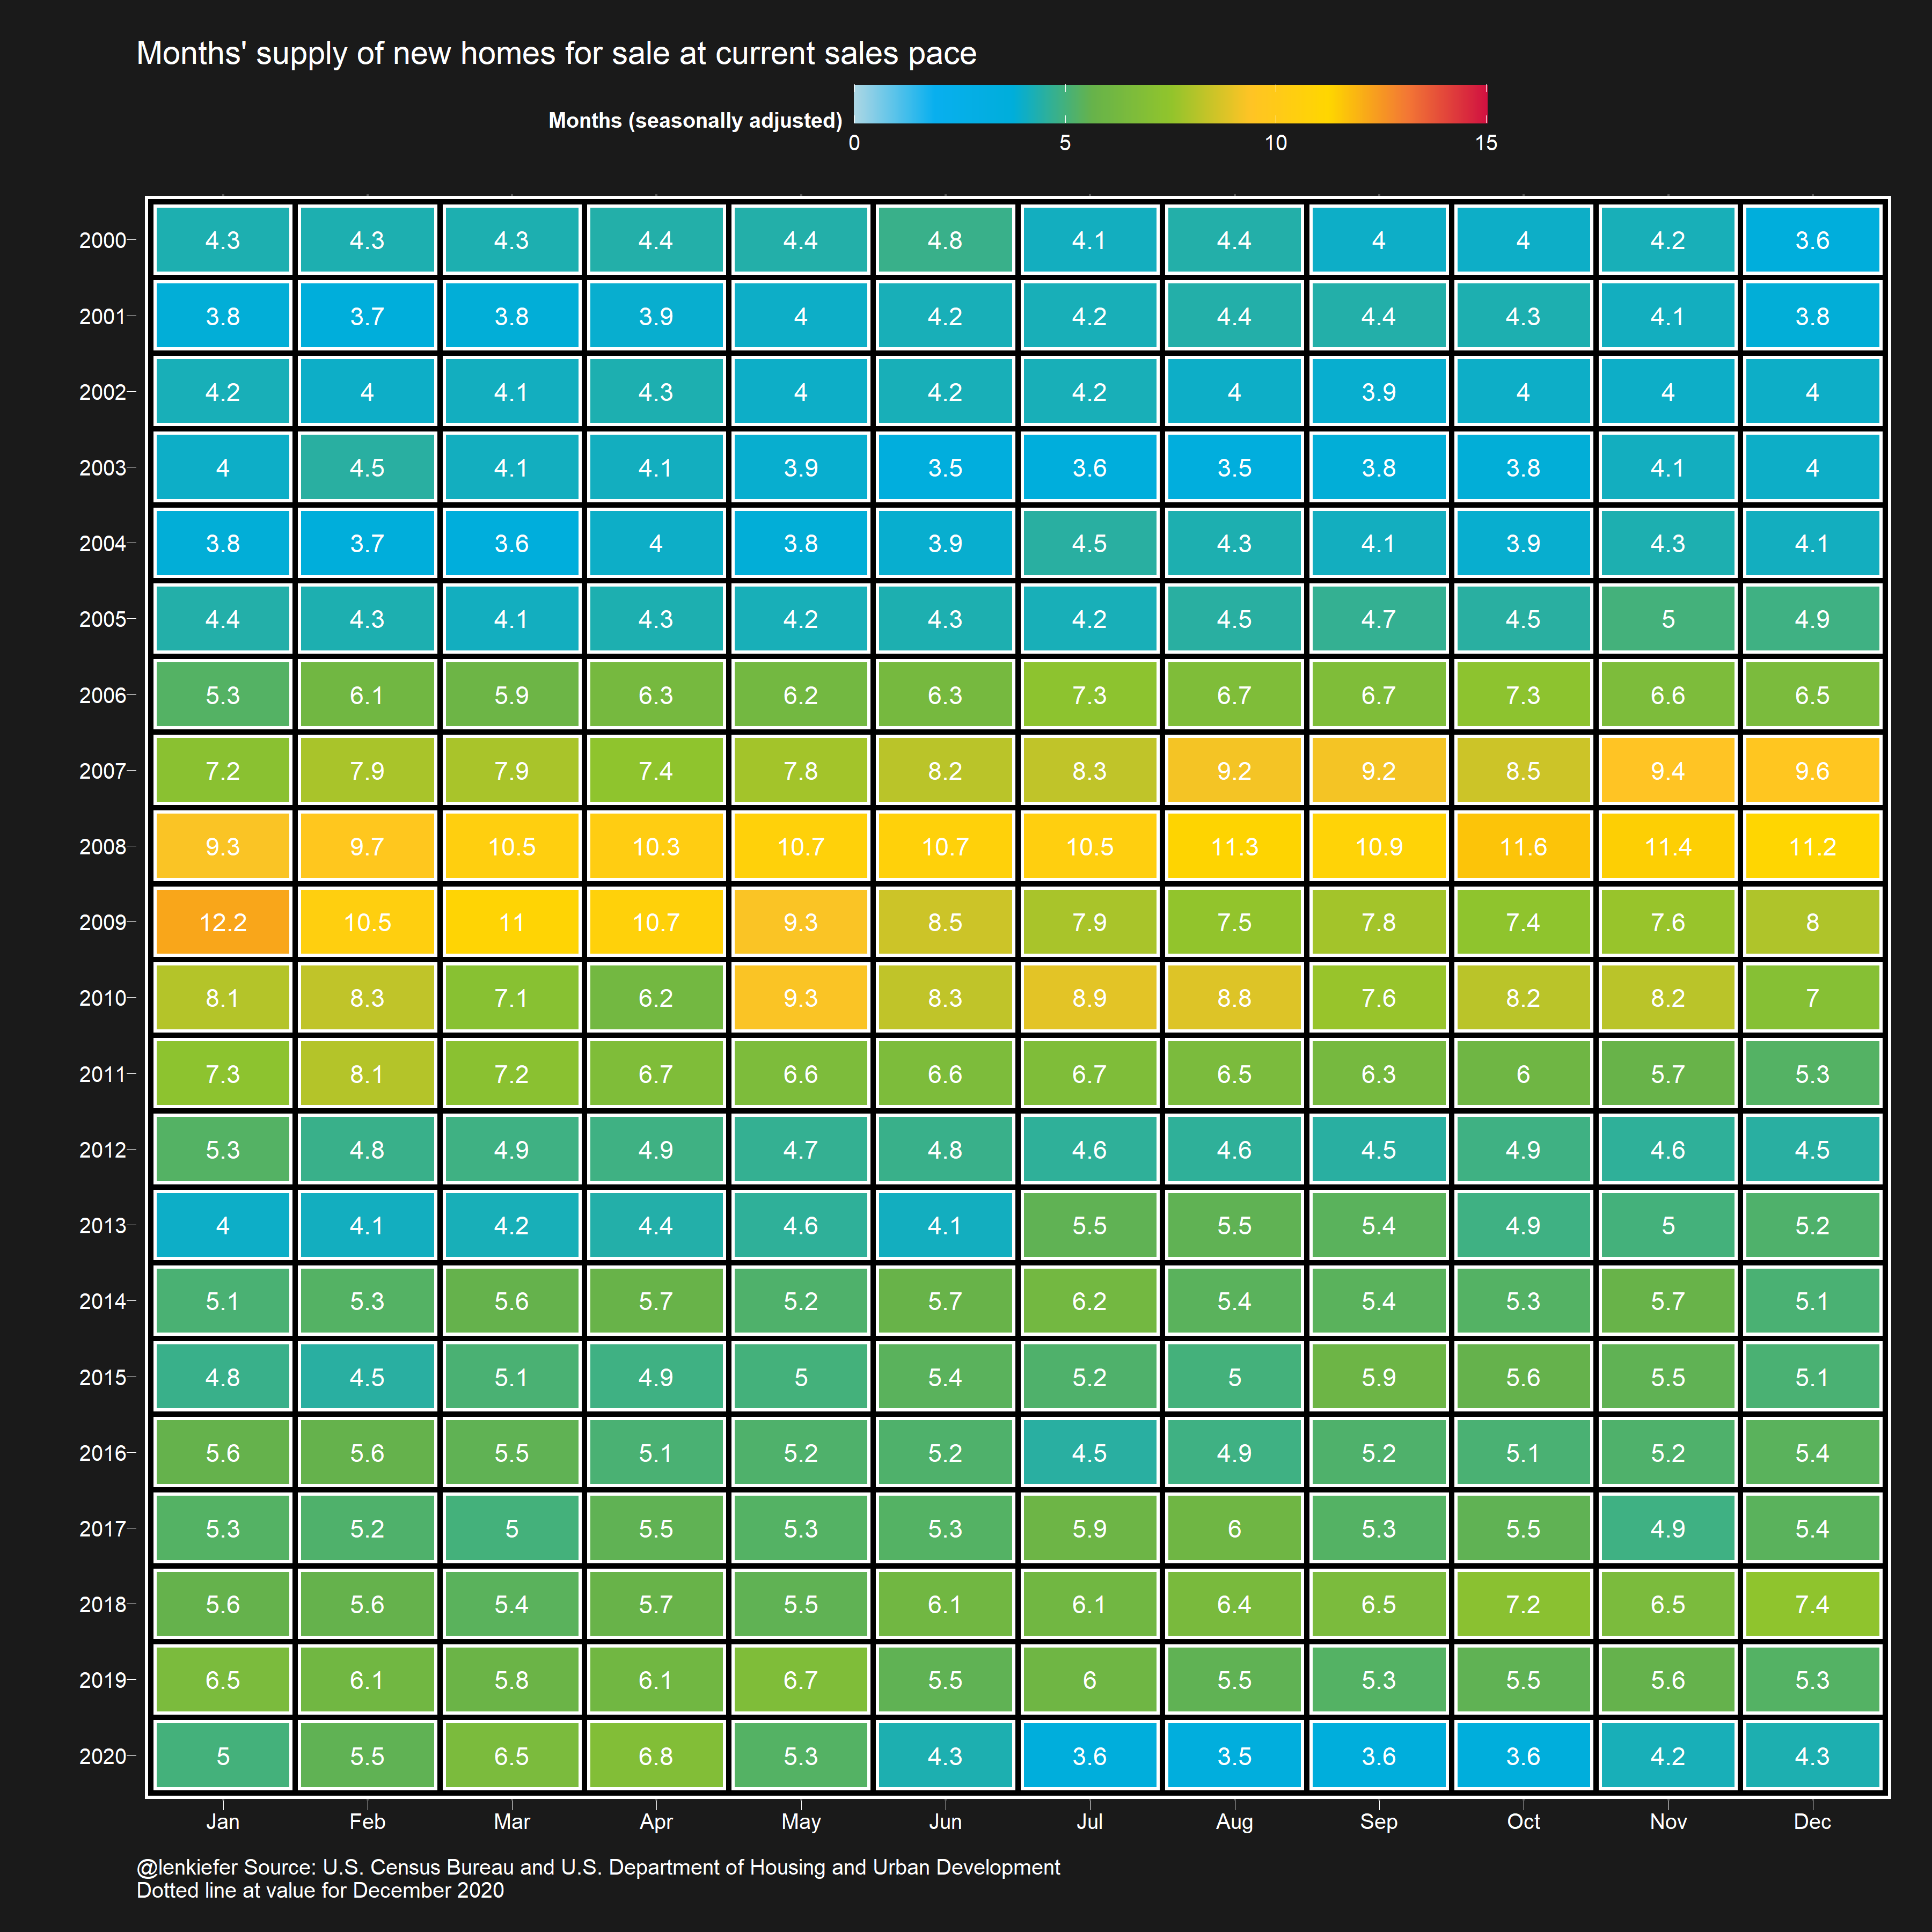
Home sales transactions are also up. Census and HUD in last week’s new residential sales release reported that New Home Sales in 2020 were the most since 2006, while inventory remains lean. The 4.3 months’ supply of available new homes was the lowest December reading since 2004.
Home purchase mortgage applications data from the MBA suggest momentum for sales has carried over into 2021. In last Wednesday’s release the MBA reported that home purchase mortgage applications were up 16% from a year ago. And near record low interest rates continue to bolster refinance activity, with refinance apps up over 80% from a year ago.
The contrast between a faltering economic recovery and a blistering single-family housing market speaks to two factors. First, the economic recovery has exacerbated deep-rooted inequalities, while many high-income workers in the knowledge economy have seen little impact so far from the economic recession, service workers have born the brunt of the leading edge of the economic contraction. Second, the pandemic has magnified forces that have been driving the housing market for several years, relatively inelastic and unresponsive housing supply combined with higher demand driven by demographic forces and super-charged by record low mortgage interest rates.
Historical analysis has shown that the diverging trends can persist for a long time, but also during these periods risks tend to build. With so many unknowns about the pandemic and associated economic fallout we’ll need to maintain heightened vigilance.