I continue to experiment with ggfx. This week I made some charts showing U.S. housing starts.
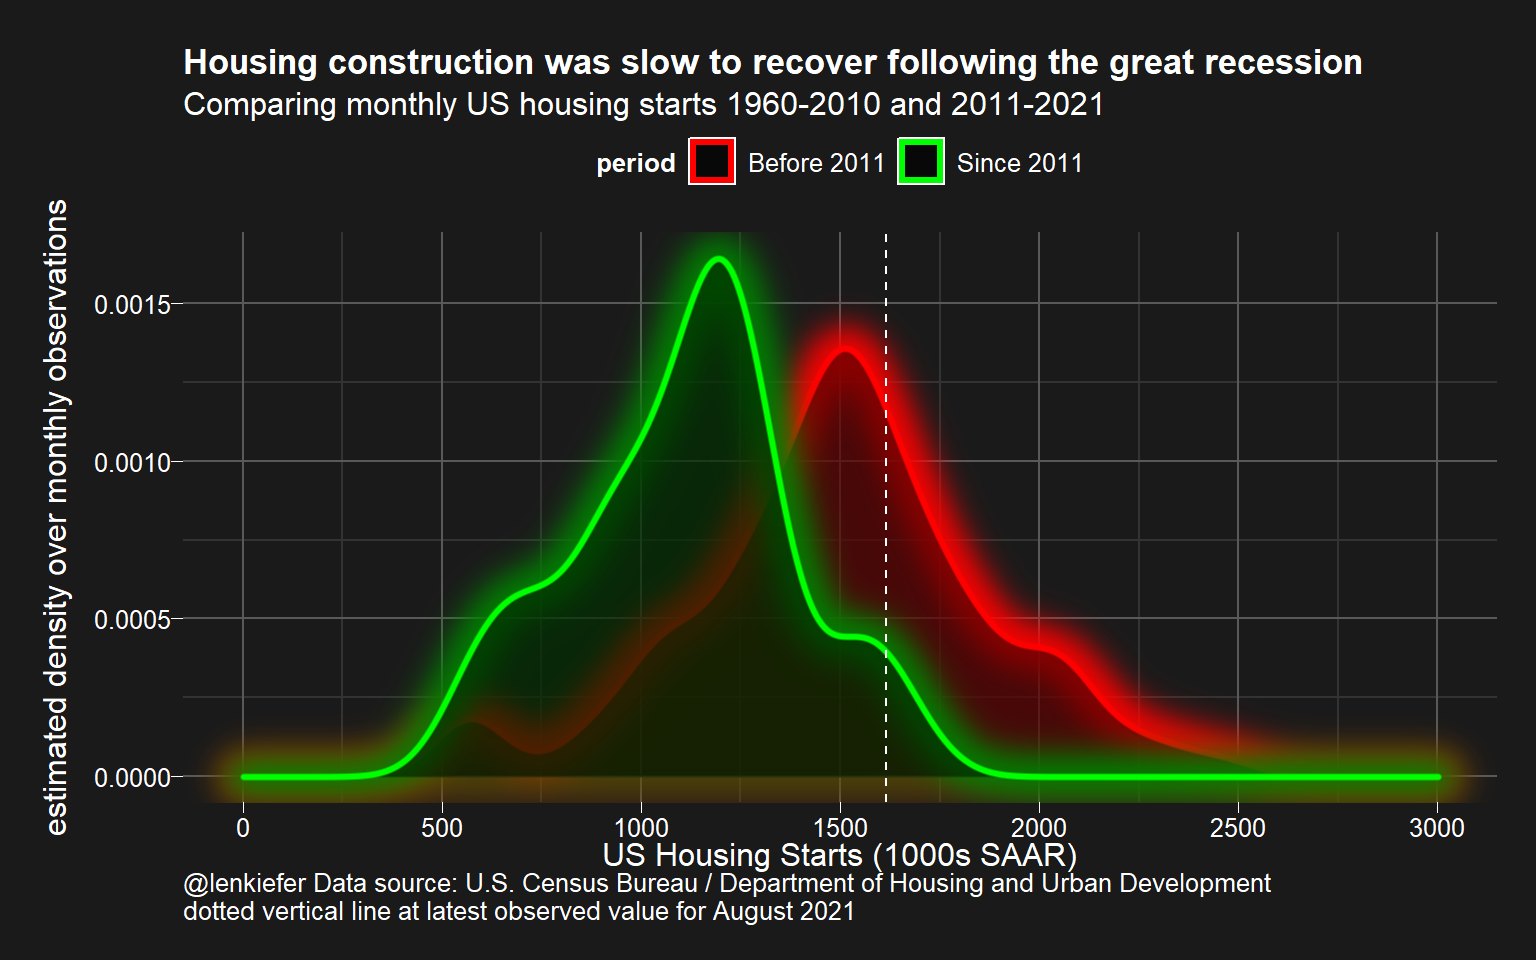
This chart emphasizes the fact that while housing starts have been increasing over the past decade, the absolute level of starts is only moderate when compared to pre-Great Recession (2008-2009) data.
I like to use the ggfx::with_outer_glow functions to create a hazy glow around the density plot.
Here is the R code for that chart.
library(tidyverse)
library(ggfx)
library(lubridate)
library(scales)
library(darklyplot) # available on my github https://github.com/lenkiefer/darklyplot

df <- tidyquant::tq_get(c("HOUST"),get="economic.data",
                         from="1000-01-01")
df <- mutate(df, decade=paste0(floor(year(date)/10),"0s"))
df <- mutate(df,period=ifelse(year(date)>2010,"Since 2011","Before 2011"))

g1 <-
ggplot(filter(df,year(date)>1959), aes(x=price,
                                        group=period,color=period)) +
  with_outer_glow(geom_density(data=.%>% filter(period=="Before 2011"),
                               fill="black",
                               alpha=0.45,size=1.1),
                  colour="red",expand=20,sigma=15)+
  with_outer_glow(geom_density(data=.%>% filter(period=="Since 2011"),
                               fill="black",
                               alpha=0.45,size=1.1),
                  colour="green",expand=20,sigma=15)+
  theme_dark2()+
  theme(legend.position="top",legend.direction="horizontal",
        plot.title=element_text(size=rel(1.2),face="bold"))+
  scale_x_continuous(limits=c(0,3000),breaks=seq(0,3000,500))+
  scale_color_manual(values=c("red","green"))+
  geom_vline(xintercept=last(df$price),linetype=2,color="white")+
  labs(x="US Housing Starts (1000s SAAR)",
       title="Housing construction was slow to recover following the great recession",
       subtitle="Comparing monthly US housing starts 1960-2010 and 2011-2021",
       y="estimated density over monthly observations",
       caption="@lenkiefer Data source: U.S. Census Bureau / Department of Housing and Urban Development\ndotted vertical line at latest observed value for August 2021")