Earlier this month I attended the National Association for Business Economics (NABE) annual policy conference in Washington D.C. LINK. One of the keynote speeches was by Alan Greenspan. During his remarks, Greenspan mentioned that while economic forecasting was hard demographic projections were the surest thing in an uncertain business.
Demographics of course are not easy, but it’s much easier to guess what the population of 30 years olds will be in 5 years than it is the predict the unemployment rate or GDP in 5 years. Forecasting is hard.
Demographics are very important for the housing market. Let’s take a step back and look at the U.S. population and compare it against the latest data on housing construction (released by Census today).
Per usual we will use R.
Get data
We could get the data direct from the primary sources, for example as in this post, but for convenience we’ll get the data via the St Louis Fed’s FRED.
Click for R code to wrangle data
# Load Libraries
library(forecast)
library(tidyverse)
library(tidyquant)

# get data
tickers <- c("HOUST","POPTHM")
#
df <- tq_get(tickers,get="economic.data",from="1959-01-01")

# data frame for recession shading
recessions.df = read.table(textConnection(
  "Peak, Trough
  1960-04-01, 1961-02-01
  1969-12-01, 1970-11-01
  1973-11-01, 1975-03-01
  1980-01-01, 1980-07-01
  1981-07-01, 1982-11-01
  1990-07-01, 1991-03-01
  2001-03-01, 2001-11-01
  2007-12-01, 2009-06-01"), sep=',',
  colClasses=c('Date', 'Date'), header=TRUE)
Our data is a simple data frame with just monthly estimates of total housing starts in the U.S. and an estimate of the resident population.
We need some further manipulations.
Click for R code transform data
df2 <-
  df %>%
  spread(symbol,price) %>%
  mutate(
    # fill down last observation on population (Feb 2019 missing so assume Jan-Feb growth rate = Dec 2018 to Jan2019)
    POPTHM=ifelse(date==max(date),lag(POPTHM)/lag(POPTHM,2)*lag(POPTHM), POPTHM),
    pg=POPTHM-lag(POPTHM,12),
    pg120 = POPTHM - lag(POPTHM,120),
    HOUST12=rollsum(HOUST,12,align="right",na.pad=TRUE)/12,
    HOUST120=rollsum(HOUST,120,align="right",na.pad=TRUE)/12,
    y=(POPTHM-lag(POPTHM,12))/HOUST12,
    y120=(POPTHM-lag(POPTHM,120))/HOUST120
    ) %>%
  filter(year(date)>1959) %>%
  mutate(yc=cummean(y))

# some labels

df_text <-
  df2 %>% mutate(decade=paste0(floor(year(date)/10),"0s")) %>%
  group_by(decade) %>%
  summarize(xmin=min(date),
            xmax=max(date),
            date=median(date),
            y=mean(y,na.rm=T)) %>%
  mutate(lab=paste0(decade," average: ",format(round(y,1),nsmall=1)))
Now that we have our data, I’ll put the chart code inside the fold.
Chart code
# housing starts chart ----
g.hs <-
  ggplot(df2, aes(x=date,y=HOUST))+
  geom_line(size=1.1)+
  labs(title="")+
  scale_y_continuous(sec.axis=dup_axis())+
  scale_x_date(breaks=seq.Date(as.Date("1970-01-01"), as.Date("2020-01-01"),"10 years"),date_labels="%Y",
               limits=c(as.Date("1970-01-01"), as.Date("2020-01-01"))
  )+
  theme_gray(base_size=12)+
  labs(x="date (monthly)",y="",
       title="U.S. housing construction still lags",
       subtitle="Monthly housing starts (1000s, SAAR)",
       caption="@lenkiefer Source: U.S. Census Bureau and Department of Housing and Urban Development\nretrieved from FRED, Federal Reserve Bank of St. Louis; https::/fred.stlouisfed.org/, March 26, 2019\nGray bars NBER recessions")+
  theme(plot.caption=element_text(hjust=0),
        plot.title=element_text(face="bold"),
        plot.subtitle=element_text(face="italic",size=rel(0.9)))

# population growth chart ----
g.pg<-
ggplot(df2, aes(x=date,y=pg120/1000))+
  geom_line(size=1.1)+
  labs(title="")+
   scale_y_continuous(sec.axis=dup_axis(),breaks=seq(20,34,2),limits=c(20,34))+
  scale_x_date(breaks=seq.Date(as.Date("1970-01-01"), as.Date("2020-01-01"),"10 years"),date_labels="%Y",
               limits=c(as.Date("1970-01-01"), as.Date("2020-01-01"))
               )+
  theme_gray(base_size=12)+
  labs(x="date (monthly)",y="",
       title="Why does everybody always want to talk about the Millennials?",
       subtitle="Cumulative 10-year Population Growth (millions)",
       caption="@lenkiefer Source: U.S. Bureau of Economic Analysis (Popultion [POPTHM])\nretrieved from FRED, Federal Reserve Bank of St. Louis; https::/fred.stlouisfed.org/, March 26, 2019")+
  theme(plot.caption=element_text(hjust=0),
        plot.title=element_text(face="bold"),
        plot.subtitle=element_text(face="italic",size=rel(0.9)))

# combo chart ----
g.combo <-
  ggplot(data=df2, aes(x=date,y=y))+
  geom_rect(data=recessions.df, inherit.aes=F,
            aes(xmin=Peak, xmax=Trough, ymin=-Inf, ymax=+Inf), fill='darkgray', alpha=0.5) +
  geom_line(size=1.05)+
  geom_line(aes(y=y120),linetype=2,color="royalblue",size=1.1)+
  geom_text(data = .%>% tail(1), aes(label="1-year"),nudge_y= -0.1,hjust=1)+
  geom_text(data = .%>% tail(1), aes(label="10-year",y=y120),color="royalblue",nudge_y=0.45,hjust=1)+
  scale_y_continuous(sec.axis=dup_axis())+
  scale_x_date(breaks=seq.Date(as.Date("1960-01-01"), as.Date("2020-01-01"),"10 years"),date_labels="%Y")+
  theme_gray(base_size=8)+
  labs(x="date (monthly)",y="",
       title="Over the past decade housing construction has not kept pace with population",
       subtitle="Cumulative 1-year (10-year) Population Growth divided by 1-year (10-year) Cumulative Housing Starts",
       caption="@lenkiefer Source: U.S. Census Bureau and Department of Housing and Urban Development (Housing Starts [HOUST])\nU.S. Bureau of Economic Analysis (Popultion [POPTHM])\nretrieved from FRED, Federal Reserve Bank of St. Louis; https::/fred.stlouisfed.org/, March 26, 2019\nGray bars NBER recessions")+
  geom_label(data=df_text, aes(y=0.2,label=lab), color="red",size=2)+
  geom_segment(data=df_text, aes(xend=xmin,x=xmax,yend=y,y=y,group=decade),color="red",linetype=4,size=1.05)+
  theme(plot.caption=element_text(hjust=0),
        plot.title=element_text(face="bold"),
        plot.subtitle=element_text(face="italic",size=rel(0.9)))
Housing Starts
Housing starts are still quite weak.
g.hs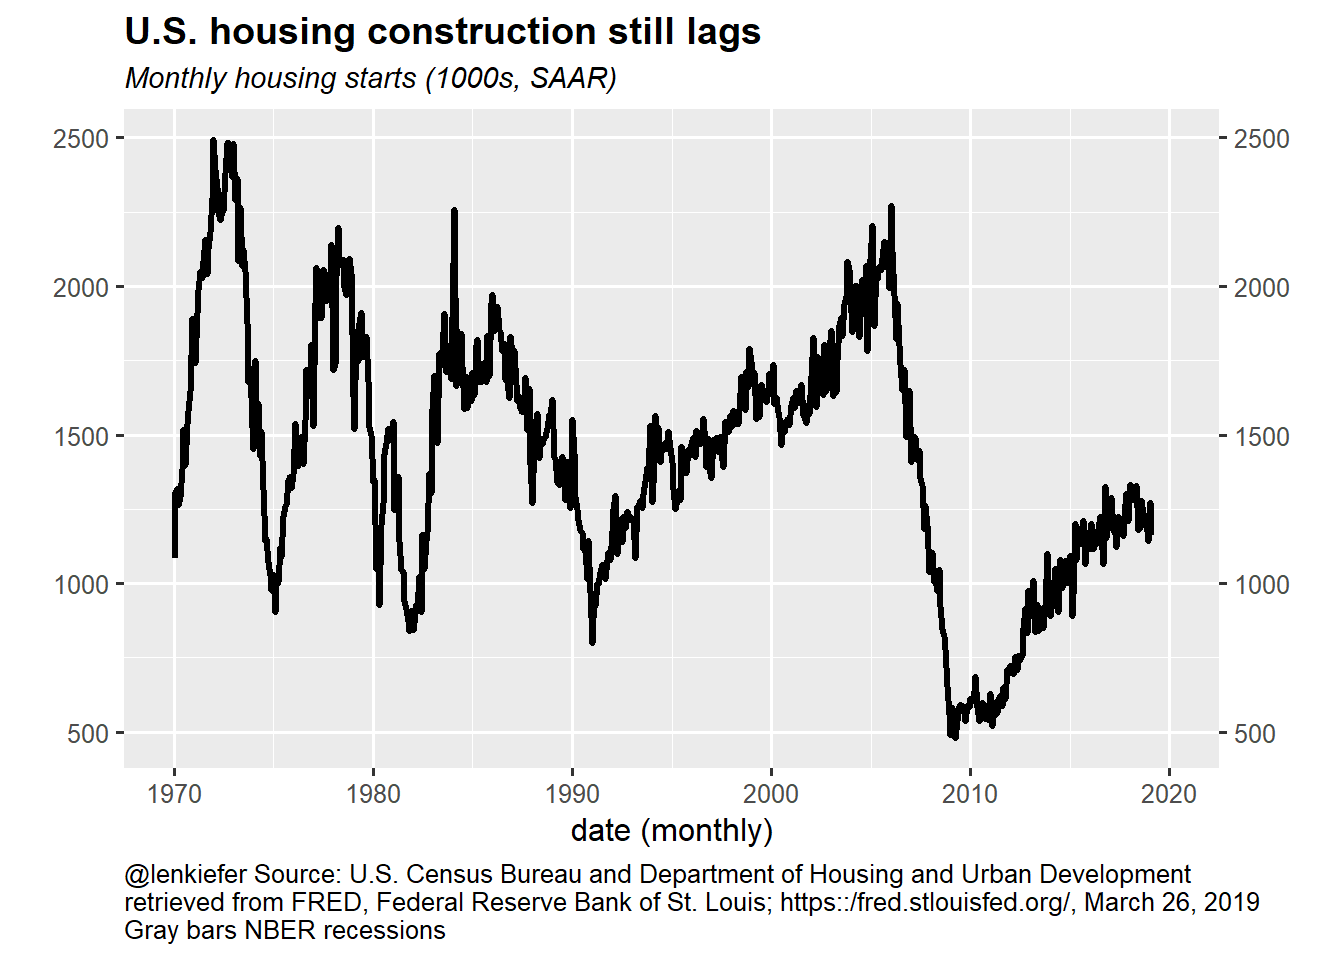
Figure 1: Monthly Housing Starts Jan 1970- Feb 2019
I tweeted a bunch more charts on housing starts today. See this thread:
lots of noise in the starts estimate, single-family starts drop 17% (+/- 11%) in February pic.twitter.com/4kZZK0gXHS
— 📈 Len Kiefer 📊 (@lenkiefer) March 26, 2019
Population Trends
The U.S. housing stock needs to expand to accommodate a growing population. Over the last 10 years the U.S. added approximately 33 million people. Over that same period cumulative total housing starts were just 9.3 million. This figure misses manufactured housing (MH) shipments, which also provide a supply of new housing. But MH shipments have been weak for most of this decade, averaging under 100k per year.
If we look at the dynamics of U.S. population growth we can see why housing analysts are so focused on the Millennials:
g.pg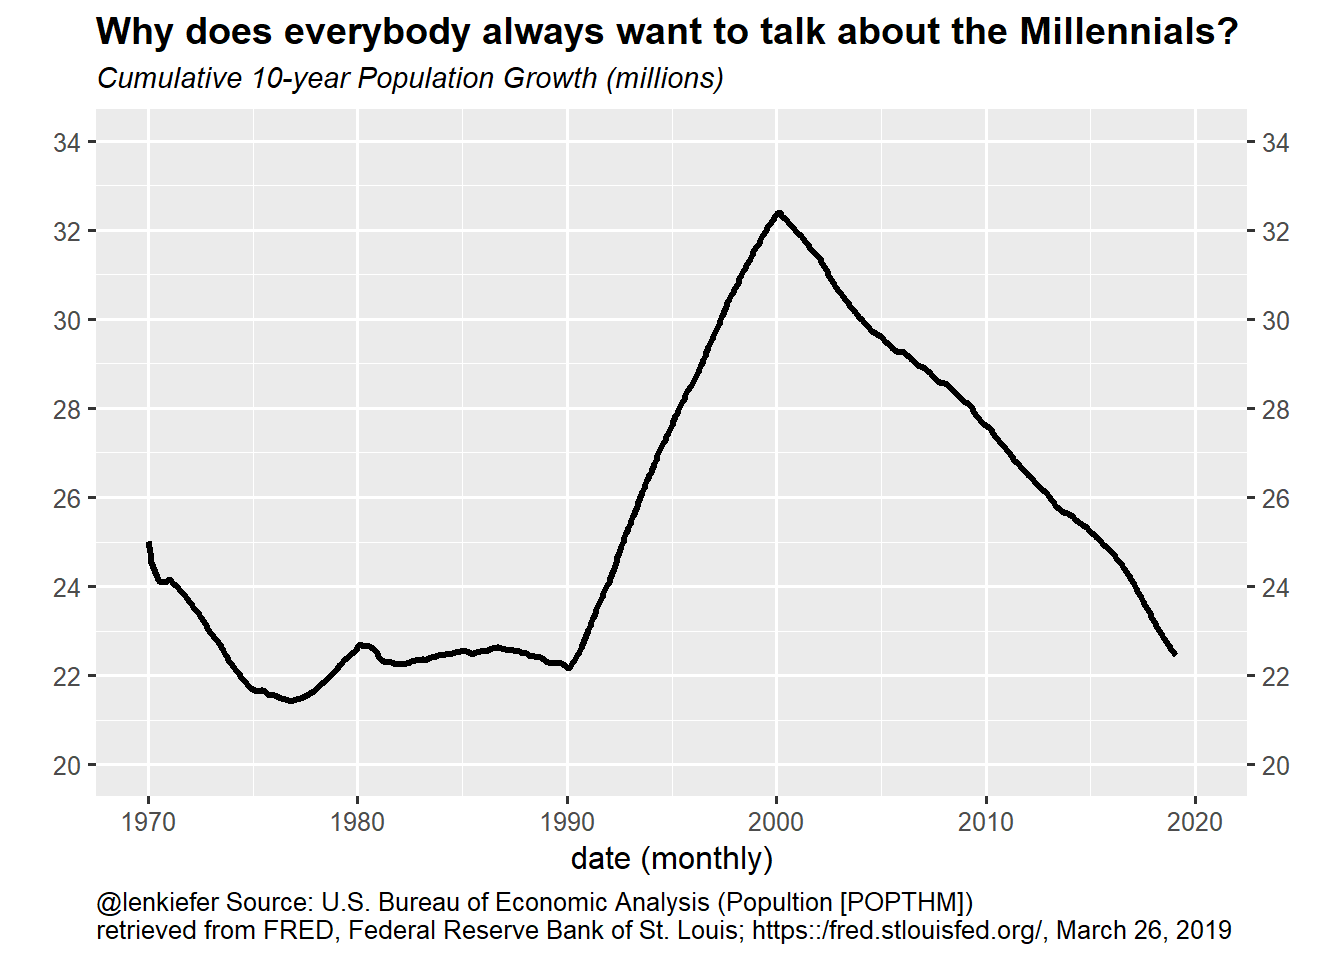
Figure 2: 10-year cumulative population growth 1970-2019
That spike in population should provide strong housing demand into the early 2020s, but slowly fade as household formations throttle down. Crudely I expect household formation to mirror the population growth lagged about 20-25 years. That misses immigration, births/deaths and other important dynamics. But as a crude way to think about it, I think this is a reasonable place to start.
Comparing construction to population
How does housing construction compare to population growth? Let’s take a look by comparing the 10-year cumulative total population growth with the 10-year cumulative total housing starts.
g.combo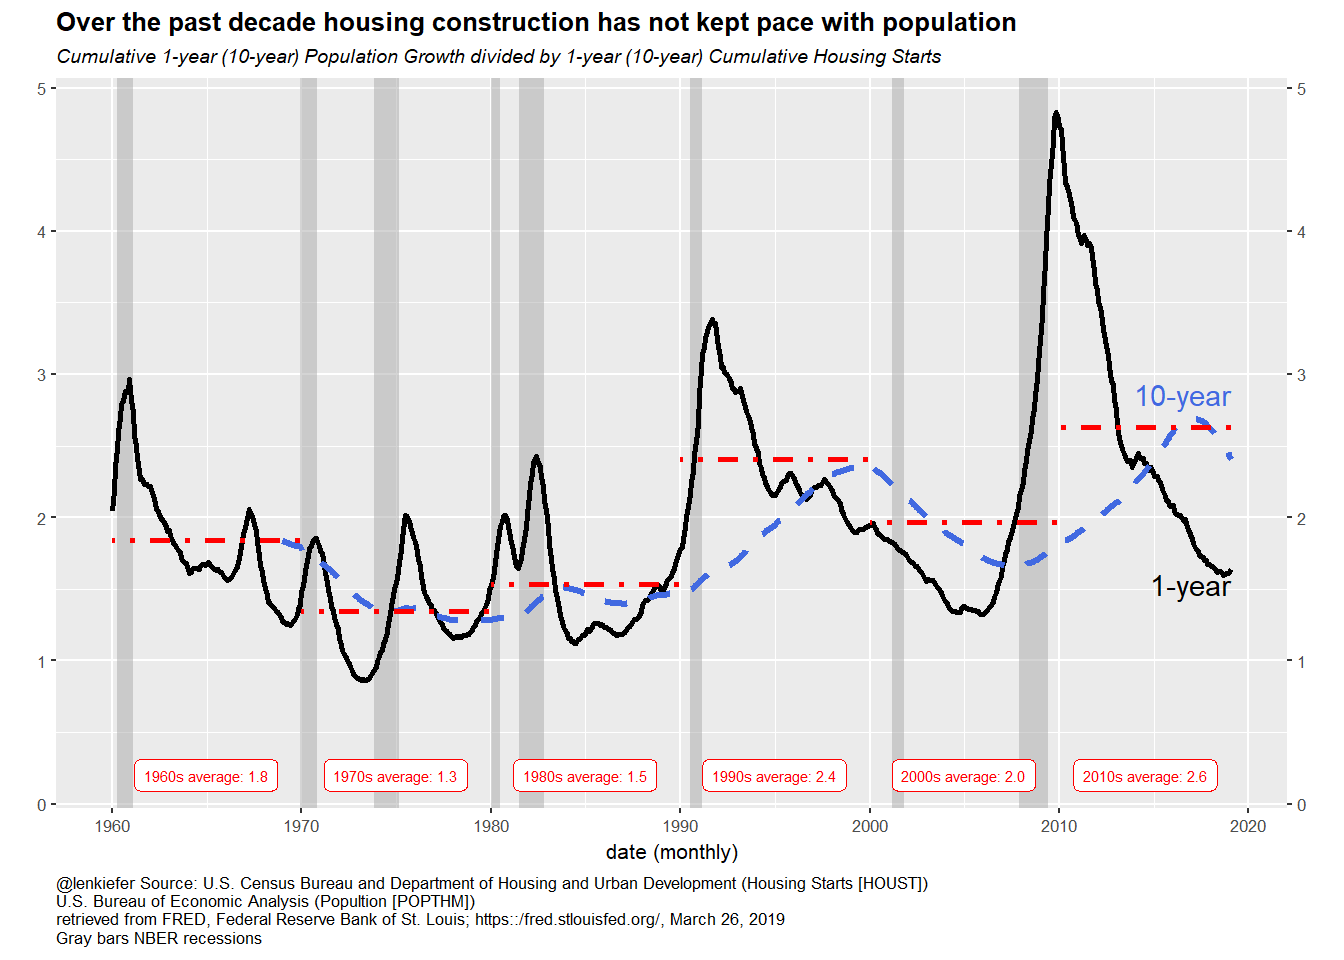
Figure 3: Population per housing start 1960-2019
This chart is remarkable to me. From the 1970s to the 1980s for every 1.5 (net) people added to the US population there was one housing start. In the 1990s, as population growth picked up, the ratio of population growth to housing starts rose to 2.4 as the bulk of the Millennial generation was born. In the 2000s we had a burst of housing construction (followed by a burst in housing activity) and the ratio fell to 2. Since the Great Recession housing construction has never ramped up while population growth continues. Over the 2010s there have been 2.6 people added to the U.S. population per housing start.
That’s not enough construction.